Consumer Behavior and Utility Maximization
21. C H A P T E R. Consumer Behavior and Utility Maximization. I. Introduction A. We spend Millions of KDs on goods and services each. yet no two consumers spend their incomes in the same way. How can this be explained?


Consumer Behavior and Utility Maximization
E N D
Presentation Transcript
21 C H A P T E R Consumer Behavior andUtility Maximization
I. Introduction • A. We spend Millions of KDs on goods and services each. yet no two consumers spend their incomes in the same way. How can this be explained? • B. Why does a consumer buy a particular bundle of goods and services rather than others? • Examining these issues will help us understand consumer behavior and the law of demand.
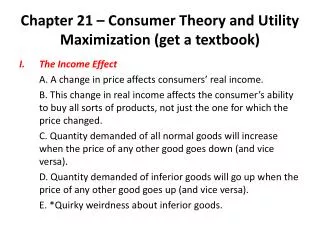
II. Two Explanations of the Law of Demand • A. Income and substitution effects explain the inverse relationship between price and quantity demanded. • 1. The income effect is the impact of a change in price on consumers’ real incomes and on the quantity of that product demanded. • An increase in price means that less real income is available to buy subsequent amounts of the product.
II. Two Explanations of the Law of Demand • A. Income and substitution effects explain the inverse relationship between price and quantity demanded. • 1. The income effect is the impact of a change in price on consumers’ real incomes and on the quantity of that product demanded. • An increase in price means that less real income is available to buy subsequent amounts of the product. You have less income to buy same amount of the product as before
2. The substitution effect • A higher price for a particular product means that the item has become relatively more expensive compared to its substitutes. (i.e. Tea and Coffee) • Therefore, consumers will buy less of this product and more of the substitutes, whose prices are relatively lower than before.
2. The substitution effect • A higher price for a particular product means that the item has become relatively more expensive compared to its substitutes. (i.e. Tea and Coffee) • Therefore, consumers will buy less of this product and more of the substitutes, whose prices are relatively lower than before. other products are cheaper now
B. The law of diminishing marginal utility This is a second explanation of the downward sloping demand curve. Although consumer wants in general are insatiable, wants for specific commodities can be fulfilled. • The more of a specific product that consumers obtain, the less they will desire more units of that product. This can be illustrated with almost any item. Can you give 1?
Utility (U) is a subjective notion in economics, referring to the amount of satisfaction a person gets from consumption of a certain item. • Marginal utility (MU) refers to the extra utility a consumer gets from one additional unit of a specific product. • In a short period of time, the marginal utility (MU) derived from successive units of a given product will decline. • This is known as diminishing marginal utility.
TOTAL AND MARGINAL UTILITY Tacos consumed per meal Total Utility, Utils Marginal Utility, Utils 30 20 10 0 1 0 10 Total Utility (utils) 0 1 2 3 4 5 6 7 Units consumed per meal 10 8 6 4 2 0 -2 Marginal Utility (utils) 1 2 3 4 5 6 7 Units consumed per meal
TOTAL AND MARGINAL UTILITY Tacos consumed per meal Total Utility, Utils Marginal Utility, Utils 30 20 10 0 1 0 10 Total Utility (utils) 10 0 1 2 3 4 5 6 7 Units consumed per meal 10 8 6 4 2 0 -2 Marginal Utility (utils) 1 2 3 4 5 6 7 Units consumed per meal
TOTAL AND MARGINAL UTILITY Tacos consumed per meal Total Utility, Utils Marginal Utility, Utils 30 20 10 0 1 2 0 10 18 Total Utility (utils) 10 8 0 1 2 3 4 5 6 7 Units consumed per meal 10 8 6 4 2 0 -2 Marginal Utility (utils) 1 2 3 4 5 6 7 Units consumed per meal
TOTAL AND MARGINAL UTILITY Tacos consumed per meal Total Utility, Utils Marginal Utility, Utils 30 20 10 0 1 2 3 0 10 18 24 Total Utility (utils) 10 8 6 0 1 2 3 4 5 6 7 Units consumed per meal 10 8 6 4 2 0 -2 Marginal Utility (utils) 1 2 3 4 5 6 7 Units consumed per meal
TOTAL AND MARGINAL UTILITY Tacos consumed per meal Total Utility, Utils Marginal Utility, Utils 30 20 10 0 1 2 3 4 0 10 18 24 28 Total Utility (utils) 10 8 6 4 0 1 2 3 4 5 6 7 Units consumed per meal 10 8 6 4 2 0 -2 Marginal Utility (utils) 1 2 3 4 5 6 7 Units consumed per meal
TOTAL AND MARGINAL UTILITY Tacos consumed per meal Total Utility, Utils Marginal Utility, Utils 30 20 10 0 1 2 3 4 5 0 10 18 24 28 30 Total Utility (utils) 10 8 6 4 2 0 1 2 3 4 5 6 7 Units consumed per meal 10 8 6 4 2 0 -2 Marginal Utility (utils) 1 2 3 4 5 6 7 Units consumed per meal
TOTAL AND MARGINAL UTILITY Tacos consumed per meal Total Utility, Utils Marginal Utility, Utils 30 20 10 0 1 2 3 4 5 6 0 10 18 24 28 30 30 Total Utility (utils) 10 8 6 4 2 0 0 1 2 3 4 5 6 7 Units consumed per meal 10 8 6 4 2 0 -2 Marginal Utility (utils) 1 2 3 4 5 6 7 Units consumed per meal
TOTAL AND MARGINAL UTILITY TU Tacos consumed per meal Total Utility, Utils Marginal Utility, Utils 30 20 10 0 1 2 3 4 5 6 7 0 10 18 24 28 30 30 28 Total Utility (utils) 10 8 6 4 2 0 -2 0 1 2 3 4 5 6 7 Units consumed per meal 10 8 6 4 2 0 -2 Marginal Utility (utils) MU 1 2 3 4 5 6 7 Units consumed per meal
Observe Diminishing Marginal Utility TOTAL AND MARGINAL UTILITY TU Tacos consumed per meal Total Utility, Utils Marginal Utility, Utils 30 20 10 0 1 2 3 4 5 6 7 0 10 18 24 28 30 30 28 Total Utility (utils) 10 8 6 4 2 0 -2 0 1 2 3 4 5 6 7 Units consumed per meal 10 8 6 4 2 0 -2 Marginal Utility (utils) MU 1 2 3 4 5 6 7 Units consumed per meal
Total utility increases as each additional taco is purchased through the first five; but utility rises at a diminishing rate since each taco adds less and less to the consumer’s satisfaction. b. At some point, marginal utility becomes zero and then even negative at the seventh unit and beyond. If more than six tacos were purchased, total utility would begin to fall. This illustrates the law of diminishing marginal utility.
III. The theory of consumer behavior uses the law of diminishing marginal utility to explain how consumers allocate their income. A. Consumer choice and the budget constraint. • Consumers are assumed to be rational, i.e. they are trying to get the most value for their money. • Consumers have clear‑cut preferences for various goods and services and can judge the utility they receive from successive units of various purchases. • Consumers’ incomes are limited because their individual resources are limited. Thus, consumers face a budget constraint.
4. Goods and services have prices and are scarce relative to the demand for them. Consumers must choose among alternative goods with their limited money incomes. • The utility maximizing rule explains how consumers decide to allocate their money incomes so that the last dollar spent on each product purchased yields the same amount of extra (marginal) utility. 5. A consumer is in equilibrium when utility is “balanced (per dollar) at the margin.” When this is true, there is no incentive to alter the expenditure pattern unless tastes, income, or prices change. 6. Table 21-1 provides a numerical example of this for an individual named Hamad with $10 to spend. Follow the reasoning process to see why 2 units of A and 4 of B will maximize Hamad’s utility, given the $10 spending limit.
Utility Maximization Rule • Of all different affordable combinations of goods and services, which combination will yield the maximum satisfaction?
Utility Maximization Rule • Of all different affordable combinations of goods and services, which combination will yield the maximum satisfaction? Affordable: Px(X) + Py(Y) = I
Utility Maximization Rule • Of all different affordable combinations of goods and services, which combination will yield the maximum satisfaction? Px/Mux = Py/MUy
Utility Maximization Rule • Of all different affordable combinations of goods and services, which combination will yield the maximum satisfaction? Affordable: Px(X) + Py(Y) = I Px/Mux = Py/MUy The consumer will allocate (I) so that the last $ spent on a product = the same amount of MU
Utility Maximization Rule • Of all different affordable combinations of goods and services, which combination will yield the maximum satisfaction? Affordable: Px(X) + Py(Y) = I Utility maximizing rule Px/Mux = Py/MUy The consumer will allocate (I) so that the last $ spent on a product = the same amount of MU
UTILITY MAXIMIZING COMBINATION $ 10 income Product A: Price = $1 Product B: Price = $2 Marginal utility per dollar (MU/price) Marginal utility per dollar (MU/price) Marginal utility, utils Marginal utility, utils Unit of product First 10 10 24 12 Second 8 8 20 10 Third 7 7 18 9 Fourth 6 6 16 8 Fifth 5 5 12 6 Sixth 4 4 6 3 Seventh 3 3 4 2
UTILITY MAXIMIZING COMBINATION $ 10 income Product A: Price = $1 Product B: Price = $2 Marginal utility per dollar (MU/price) Marginal utility per dollar (MU/price) Marginal utility, utils Marginal utility, utils Unit of product First 10 10 24 12 Second 8 8 20 10 Third 7 7 18 9 Fourth 6 6 16 8 Fifth 5 5 12 6 Sixth 4 4 6 3 Seventh 3 3 4 2 1 unit of (A) and 2 units of (B) is affordable: 1(1) + 2(2) = 5$ Still $5 left!
UTILITY MAXIMIZING COMBINATION $ 10 income Product A: Price = $1 Product B: Price = $2 Marginal utility per dollar (MU/price) Marginal utility per dollar (MU/price) Marginal utility, utils Marginal utility, utils Unit of product First 10 10 24 12 Second 8 8 20 10 Third 7 7 18 9 Fourth 6 6 16 8 Fifth 5 5 12 6 Sixth 4 4 6 3 Seventh 3 3 4 2 4 of (A) and 5 of (B) 1(4) + 2(5)=$11 Not affordable
UTILITY MAXIMIZING COMBINATION $ 10 income Product A: Price = $1 Product B: Price = $2 Marginal utility per dollar (MU/price) Marginal utility per dollar (MU/price) Marginal utility, utils Marginal utility, utils Unit of product First 10 10 24 12 Second 8 8 20 10 Third 7 7 18 9 Fourth 6 6 16 8 Fifth 5 5 12 6 Sixth 4 4 6 3 Seventh 3 3 4 2 2 of (A) and 4 of (B) 1(2) + 2(4) =$10
3. It is marginal utility per dollar spent that is equalized; that is, consumers compare the extra utility from each product with its cost. 4. As long as one good provides more utility per dollar than another, the consumer will buy more of the first good; as more of the first product is bought, its marginal utility diminishes until the amount of utility per dollar just equals that of the other product.
Next… Chapter 22 The Costs of Production