NASA B-757 Turbulence Flight Experiment Setup
180 likes | 379 Vues
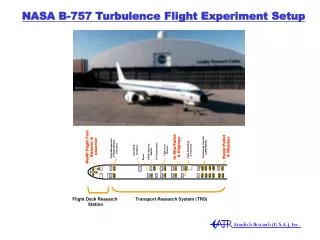
WxAP Flight Test Director & observer. Technology Transfer (AWIN/EWxR). In Situ Pallet & Displays. Radar Pallet & Displays. Flight Management & Flight Systems Interfaces. Video Recording & Telemetry. I/O Concentrator. ONYX Operator Station. Flight Test Director. SGI ONYX

NASA B-757 Turbulence Flight Experiment Setup
E N D
Presentation Transcript
WxAP Flight Test Director & observer Technology Transfer (AWIN/EWxR) In Situ Pallet & Displays Radar Pallet & Displays Flight Management & Flight Systems Interfaces Video Recording & Telemetry I/O Concentrator ONYX Operator Station Flight Test Director SGI ONYX Computer Power Flight Deck Research Station Transport Research System (TRS) NASA B-757 Turbulence Flight Experiment Setup
Turbulence severity transmissions “auto PIREP’s” (thresholded onboard receiving aircraft) On-board aircraft systems: - turbulence hazard metric - eddy dissipation rate measurement Tactical Products reported/forecast turbulence updates Communications Network eddy dissipation rate Strategic Products AOC, Dispatch, ATC, FBO: - forecast/reported turbulence - location and severity NWS, FSS “Free Wx” (e.g., RUC-2) Turbulence forecast models Turbulence Product Integration in Communications Infrastructure • Improved situational awareness of turbulence hazards • Improved turbulence forecast/warnings
In Situ Flight Experiment Data Analysis • Data quality assessment • Wind recovery algorithms • Eddy dissipation rate algorithms • Distributed load analysis
In Situ Flight Experiment Data Analysis:Preliminary Findings • All in situ algorithms have been “shaken out” and verified to be working correctly • On board air data system capable of making acceptable turbulence measurements • Several (>12) events encountered providing an excellent database for algorithm assessment and development • Initial assessment of aircraft flexibility effects on distributed loads underway
Flight 190Event 6 Characteristics • Altitude : 24,000 ft • Mach: 0.67 • Weight Average: 183,200 lbs • Airspeed: TAS-215 m/s Indicated- 290 kts • e1/3 peaks: 0.5 to 0.8 m2/3/s • c.g. peaks: +0.75g / -1.3g • sDn peaks: 0.35 g • sWg peaks: 4.4 m/s • Roll on run start, heading changes throughout run
Flight 191Event 6 Characteristics • Altitude : 33,000 ft • Mach: 0.76 to 0.78 • Weight Average: 177,700 lbs • Airspeed: TAS-235 m/s Indicated- 275 kts • e1/3 peaks: 0.7 to 0.8 m2/3/s • c.g. peaks: +0.80g / -1.5g • sDn peaks: 0.44 g • sWg peaks: 9.8 m/s • Roll maneuvers at end [on escape vector] • 200 ft drop in altitude on R.M.S. Normal Load spike