Download
1 / 1
10 likes | 148 Vues
Altimetric Mean Sea Surfaces – and Inter-annual sea level variability (DNSC05-MSS). Ole B. Andersen, Anne L. Vest and Per Knudsen, Danish National Space Center. ABSTRACT

E N D
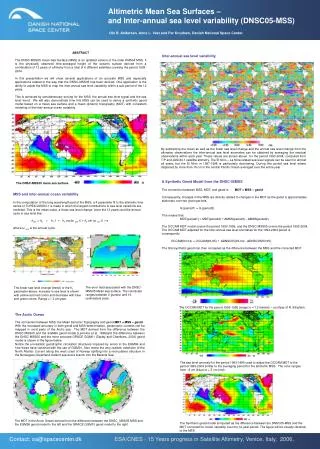
Altimetric Mean Sea Surfaces – and Inter-annual sea level variability (DNSC05-MSS) Ole B. Andersen, Anne L. Vest and Per Knudsen, Danish National Space Center. ABSTRACT The DNSC-MSS05 mean Sea Surface (MSS) is an updated version of the older KMS04 MSS. It is the physically observed time-averaged height of the ocean’s surface derived from a combination of 12 years of altimetry from a total of 6 different satellites covering the period 1993-2004. In this presentation we will show several applications of an accurate MSS and especially applications related to the way that the DNSC-MSS05 has been derived. One application is the ability to adjust the MSS to map the inter-annual sea level variability within a sub-period of the 12 years. This is achieved by simultaneously solving for the MSS, the annual sea level signal and the sea level trend. We will also demonstrate how this MSS can be used to derive a synthetic geoid model based on a mean sea surface and a mean dynamic topography (MDT) with consistent modeling of the inter-annual ocean variability. Inter-annual sea level variability By subtracting the mean as well as the linear sea level change and the annual sea level change from the altimetric observations the inter-annual sea level anomalies can be obtained by averaging the residual observations within each year. These values are shown above for the period 1993-2004, computed from T/P and JASON-1 satellite altimetry. The El Nino – La Nina related sea level signals can be seen for almost all years, but the El Nino in 1997-1998 is particularly dominating. During this period sea level where displaced by more than 15 cm in the central Pacific Ocean averaged over the entire year. A Synthetic Geoid Model from the DNSC-05MSS The connection between MSS, MDT, and geoid is MDT = MSS – geoid Consequently, changes in the MSS are directly related to changes in the MDT as the geoid is approximately stationary over two given periods. G (period1) = G (period2) This means that MDT(period1) = MDT(period2) + ΔMSS(period1) - ΔMSS(period2) The OCCAM MDT model covers the period 1993-1995, and the DNSC-MSS05 covers the period 1993-2004. The OCCAM MDT adjusted for the inter-annual sea level anomalies for the 1993-2004 period is consequently OCCAM(93-04) = OCCAM(93-95) + ΔDNSC05(93-04) - ΔDNSC05(93-95) The final synthetic geoid can then computed as the difference between the MSS and the corrected MDT. The DNSC-MSS05 mean sea surface. MSS and inter-annual ocean variability In the computation of the long wavelength part of the MSS, a 4 parameter fit to the altimetric time series of TOPEX/JASON-1 is made in which the largest contributions to sea level variations are modeled. This is the mean value, a linear sea level change (over the 12 years) and the annual cycle in sea level like: hobs = h0 + h1 t + h2 cos(ωannt) + h3 sin (ωannt) + e where ω ann is the annual cycle. The error field associated with the DNSC-MSS05 Mean sea surface. The colorscale ranges between 0 (purple) and 10 centimeters (red). The linear sea level change (trend) or the h1 parameter above. Increase in sea level is shown with yellow and red colors and decrease with blue and green colors. Range +/- 2 cm/year. The OCCAM MDT for the period 1993-1995 (range is +/1 2 meters) – courtesy of R. Bingham. The Arctic Ocean The connection between MSS, the Mean Dynamic Topography and geoid:MDT = MSS – geoid With the increased accuracy in both geoid and MSS determination, geostrophic currents can be mapped in most parts of the Arctic sea. The MDT derived from the difference between the DNSC-MSS05 and the EGM96 geoid model (Lemoine et al. 1998)and the difference between the DNSC-MSS05 and the more accurate GRACE GGM01 (Tapley and Chambers, 2003) geoid model is shown in the figure below. Notice the un-realistic geostrophic circulation structures imposed by errors in the EGM96 and how these have vanished with the use of GGM01. Also notice the very realistic extension of the North Atlantic Current along the west coast of Norway splitting into a recirculation structure in the Norwegian-Greenland-Iceland sea and a branch into the Barents Sea. The sea level anomaly for the period 1993-1995 used to adjust the OCCAM MDT to the period 1993-2004 similar to the averaging period for the altimetric MSS. The color ranges from –5 cm (blue) to + 5 cm (red). The MDT in the Arctic Ocean derived from the difference between the DNSC_MSS05 MSS and the EGM96 geoid model to the left and the GRACE GGM01 geoid model to the right. The Syntheric geoid model somputed as the difference between the DNSC05-MSS and the MDT corrected for ocean variatility over the 12-year period. The figure will be visually identical to the MSS . Contact: oa@spacecenter.dkESA/CNES - 15 Years progress in Satellite Altimetry, Venice, Italy, 2006,