Understanding Functions and Their Graphs: A Comprehensive Guide
This guide explores essential mathematical concepts related to functions, including definitions, types, and graphical representations. It covers one-to-one mappings, linear functions represented by straight lines, quadratic functions depicted as parabolas, and cubic functions with their unique characteristics. Additionally, it introduces reciprocal functions, highlighting their hyperbolic shape and asymptotic behavior. Exercises are provided to reinforce understanding and application of these concepts. Perfect for learners looking to deepen their knowledge of functions and graphs.

Understanding Functions and Their Graphs: A Comprehensive Guide
E N D
Presentation Transcript
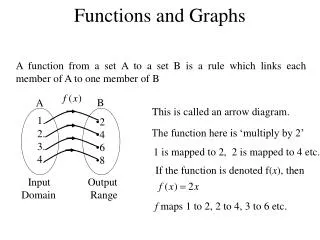
1. 2. 3. 4. • 2 • 4 • 6 • 8 Functions and Graphs A function from a set A to a set B is a rule which links each member of A to one member of B B A This is called an arrow diagram. The function here is ‘multiply by 2’ 1 is mapped to 2, 2 is mapped to 4 etc. If the function is denoted f(x), then Input Output Domain Range f maps 1 to 2, 2 to 4, 3 to 6 etc.
Graphs of Functions A graph gives a picture of a function. It shows the link between the sets of numbers in the input (domain) and the output (range). The straight line is the graph of the function y = 2x for 0 x 6. Output Input Functions which produce a straight line are known as Linear Functions. Linear functions are of the form y = ax + b
The Quadratic Function The parabola shown here is a graph of the function y = x2 for -5 x 5. The graph has a minimum value of 0 when x = 0. Parabolas are symmetrical. The axis of symmetry passes through the turning point of the graph. The axis of symmetry is x = 0. A function of the form y = ax2 + bx + c is a quadratic function. The graph of a quadratic is always a parabola.
Cubic Functions We will now draw the graph of y = x3 x -4 -3 -2 -1 0 1 2 3 4 -64 -27 -8 -1 0 1 8 27 64 y
x -4 -3 -2 -1 0 1 2 3 4 -64 -27 -8 -1 0 1 8 27 64 y Page 24 Exercise 4
Reciprocal Functions x -24 -16 -12 -8 -6 -4 -3 -1 0 1 3 4 6 8 12 16 24 -1 -1.5 -2 -3 -4 -6 -8 –24 __ 24 8 6 4 3 2 1.5 1 y
x -24 -16 -12 -8 -6 -4 -3 -1 0 1 3 4 6 8 12 16 24 -1 -1.5 -2 -3 -4 -6 -8 –24 __ 24 8 6 4 3 2 1.5 1 y NOTE: this function is undefined when x = 0. The shape of the graph is called a hyperbola. It has two branches. The axes are called asymptotes to the curve. This is because the graph approaches but never touches them.
Page 25 Exercise 5 Page 27 Exercise 6 Check up on page 29