Download
1 / 14
140 likes | 339 Vues
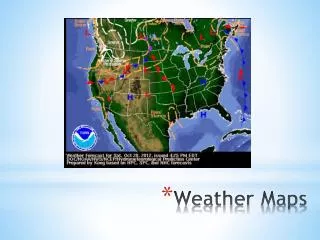
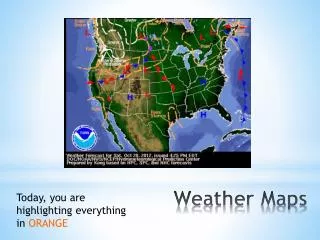
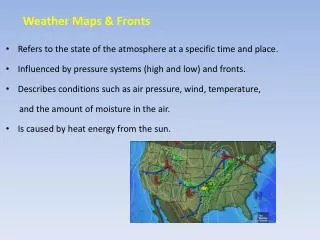
Understanding Weather Maps. Signs and symbols. Low Pressure. Low pressure means cloudy weather and precipitation are on the way Low pressure systems have different intensities with some producing a gentle rain while others produce hurricane force winds. High Pressure.

E N D
Understanding Weather Maps Signs and symbols
Low Pressure Low pressure means cloudy weather and precipitation are on the way Low pressure systems have different intensities with some producing a gentle rain while others produce hurricane force winds.
High Pressure This usually means your region has several partly to mostly sunny days in store with little or no precipitation. Air tends to sink near high-pressure centers, which inhibits precipitation and cloud formation. This is why high-pressure systems tend to bring bright, sunny days with calm weather. (remember, high pressure = high density + sinking) Sunny doesn’t necessarily mean warm.
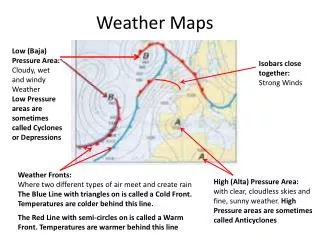
Pressure • The circles and lines we see on a weather maps with numbers are called Isobars (equal bars). Isobars are lines of equal atmospheric pressure drawn on a meteorological map. The numbers are pressure given in Millibars. • 1 Mb = 0.02953 inches of mercury (meteorologists use mercury barometers to measure pressure) • There is no exact number for high or low pressure. It’s all relative
Pressure • Isobars can never cross or touch • Isobars must be given in amounts of 1000 +/- 4 (992, 996, 1000, 1004, 1008, and so on) • Isobars are corrected for sea level, so any differences in pressure due to altitude are ignored and only differences due to weather conditions (like temperature) are considered.
Warm Front Even though a warm front is gentler than a cold front, since warm air is lighter and less dense than cold air, the cold air ahead of a warm front at the surface must retreat before warm air can move in. Sometimes, cold air is very stubborn and hard to move, which slows the warm front down and can lead to several days of wet weather.
Cold Front As a cold front moves into an area, the heavier, cool air pushes under the lighter, warm air it's replacing. The warm air cools as it rises. If the rising air is humid enough, water vapor in it will condense into clouds and maybe precipitation. In the summer, an arriving cold front can trigger thunderstorms, sometimes severe thunderstorms with large hail, dangerous winds and even tornadoes.
Occluded Fronts Occluded fronts can signal weakening of storm Often, in the later stages of a storm's life cycle, a frontal occlusion occurs. This happens when the air in the warm sector of the storm is lifted off the ground.
Stationary Fronts A cold front is the boundary between cool and warm air when the cool air is replacing the warm air. A warm front is the boundary when the warm air is winning the battle. When the pushing is a standoff, the boundary is known as a stationary front. Stationary fronts often bring several days of cloudy, wet weather that can last a week or more.
Trough Troughs are boundaries of low pressure. (Remember Monsoon Troughs – hurricanes?) Air sinks on the west side of troughs, which inhibits clouds and precipitation. On weather maps of the Northern Hemisphere, troughs are shown by upper-air winds, or jet streams, blowing south and then turning back to the north. Strong upper-level troughs can be become negatively tiltedand are associated with Arctic outbreaks and major snowstorms during winter. Surface low pressure areas tend to develop to the east of upper-level troughs in the rising air.