Weather Maps
Weather & Climate. Weather Maps. Weather is the state of the atmosphere at any one place or time . This includes: humidity, temperature, sunshine hours, cloud cover, precipitation (any moisture reaching the earth’s surface). This includes rain, sleet, snow, hail, dew and frost. Song:

Weather Maps
E N D
Presentation Transcript
Weather & Climate Weather Maps
Weather is the state ofthe atmosphere at anyone place or time. This includes: humidity, temperature, sunshine hours, cloud cover, precipitation (any moisture reaching the earth’s surface). This includes rain, sleet, snow, hail, dew and frost. Song: http://www.youtube.com/watch?v=c3MKsTLnTKc Climate is the average or long term weather conditions of a region. It is the result of years of research into data. Weather and Climate
Weather or Climate Weather Climate Hot and dry conditions, together with strong winds, led to Bushfires near Wagga. At this time of year Darwin usually experiences hot and wet weather. The maximum temperature in Moscow today is -23oC On Monday night a southerly change arrived about 10:30pm
Weather or Climate Weather Climate Tully in Queensland is Australia’s wettest town. September was chosen for the 2000 Olympics because that month usually has the best weather. On New Year’s Day the temperature in Sydney was 45oC Sydney receives more rain per year than London
Bureau of Meteorology • http://www.bom.gov.au/ • http://www.aus-emaps.com/severe_weather.php
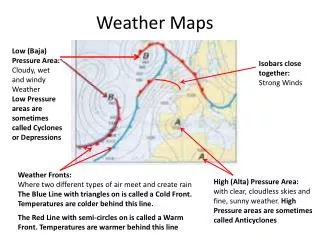
Atmospheric pressure • Atmospheric pressure or barometric pressure is the pressure exerted by the weight of the air on the earth’s surface. • Atmospheric pressure is measured in hectopascals (hPa). • Atmospheric pressure is mapped to form isobars. • http://www.juicygeography.co.uk/animations.htm#downloads/flash/highpressure.swf
Isobars • Are lines on a synoptic chart joining places of equal atmospheric pressure. • To estimate atmospheric pressure you need to refer to the two nearest isobars. e.g. if point “A” is situated half way between 1020 hPa and 1024 hPa, “A” would be > 1020 but < 1024 hPa.
Atmospheric Pressure readings How do they get the land and sea readings? What do all these dots form when they are linked?
Isobars How do you work out which are high pressure cells and which are low pressure cells? An isobar is a line on a map joining places of equal atmospheric pressure
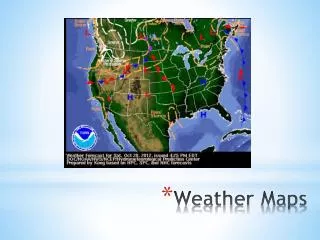
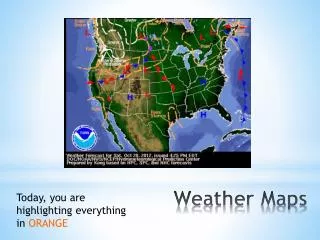
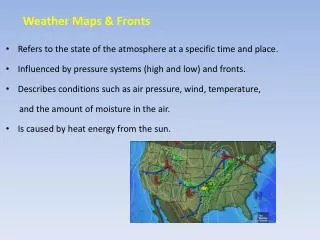
Synoptic Charts • Synoptic charts or weather maps provide a snapshot of the weather experienced at a particular place at a certain time. • They show information relating to air pressure, air masses and fronts, cloud cover, wind speed, wind direction and rainfall. • This information allows us to make predictions relating to temperature, humidity, ocean conditions and the likely weather for the next few days.
Synoptic Charts Synoptic Charts What does the shading refer to? What is the wind speed and direction? What is this feature? What is the air pressure?
Pressure cells - are defined by the patterns formed by isobars. • Are these high pressure cell s or a low pressure cells? • How can you tell?
http://www.bom.gov.au/lam/Students_Teachers/pressure.shtml • http://www.bom.gov.au/lam/Students_Teachers/Worksheet23.shtml
occur where atmospheric pressure increases towards the centre of the system. High pressure systems are characterised by light winds, clear skies, dry weather and a high diurnal (daily) temperature range. A ridge is an extension of high pressure from a high pressure system. http://www.bom.gov.au/weather/national/charts/synoptic.shtml High pressure cells (anticyclones)
High pressure cells • Why does the air descend? • Why does the air moves outwards?
Typical weather associated with High pressure • light winds • clear skies, dry weather • higher diurnal (daily) temperature range i.e. hot days (sun rays maximum effect) • cool nights (because of lack of cloud cover). • Frosts are likely in winter.
Low pressure cells (cyclones or depressions) • occur where atmospheric pressure decreases towards the centre of the system. • Low pressure systems are associated with stronger winds, cloudy skies, rain • a lower diurnal temperature range. • A trough is an extension of low pressure from a low pressure system.
Low pressure cells Ascending air • Why does the air rise? • Why does the air moves inwards?
Typical weather associated with Low pressure • strong winds, cloudy skies, rain and a lower diurnal (daily) temperature range i.e. mild temperatures (sun does not have maximum effect because of cloud cover, heat trapped in at night). • Frosts are unlikely.
Tropical cyclones (T.C.) • Are avery intense low pressure system. They generate very strong winds, produce rough seas and heavy rains • Wide spread damage occurs if they make landfall (contact with land).
What is wind? • Wind is the movement of air masses (common bodies of air) from high pressure areas (highs) to low pressure areas (lows). The effect of this movement of air is to rebalance the pressure in the atmosphere. • Note that: • the greater the difference between the high and the low pressure, the greater the wind speed will be, and • the closer together the isobars are on the weather map, the stronger the winds will be.
Wind speed • is determined by the closeness of the isobars. The closer the isobars the stronger the winds. • A steep pressure gradient exists where isobars are close together. • If isobars are far apart a place will generally experience light winds. This is called a slight pressure gradient.
Note the closeness of the isobars Note the spaced isobars
Reading Wind Direction on a Weather Map Sydney Easterly√ (Remember that we name our wind direction on where the wind came from) Not where its going too x N Close up of a map
How to Read Wind Speed on a Weather map To work out the wind speed of an area, all you need to do is match up the wind speed symbol found on the map with the symbol found in the key A The wind speed at point A is 5 km/hr Legend- Wind Speed 30 km/hr 5 km/hr 10 km/hr Calm 20 km/hr
Wind direction • Wind is named according to the direction the wind is coming from, e.g. south = southerly. • Wind direction is largely determined by the location of pressure systems.
Wind direction Remember we always refer to where the wind is coming from! Where has the wind come from? 1 2
Wind Direction – Anticyclones (High Pressure cells) • In the southern hemisphere winds blow outwards in an anticlockwise direction from areas of high pressure. ANTICYCLONE = ANTICLOCKWISE WINDS.
Wind blows outwards in an anticlockwise direction in areas of high pressure. ANTICYCLONE = ANTICLOCKWISE WINDS.
Wind Direction – Depressions (Low pressure cells) • In the southern hemisphere winds associated with low pressure systems blow in a clockwise direction towards the centre of the system. LOW T. C. = CYCLONE = CLOCKWISE WINDS.
Winds blow towards the centre of a low pressure system and in a clockwise direction LOW P. C. = CYCLONE = CLOCKWISE WINDS.
Wind indicators • Wind indicators show wind speed and direction. • The feather indicates wind speed • The shaft indicates the direction from which the wind is coming • The black dot is the place that is experiencing the windy conditions
Identifying wind direction • First - Identify the type of pressure system. • Southern Hemisphere LOW =clockwise HIGH = anticlockwise. • (the reverse is true in the northern hemisphere) • Wind, generally speaking, moves across the isobars
How do you read wind direction without windsticks? The black arrows show the wind direction. High and low pressure regions do not stay in the same place. They move over the Earth's surface.
A front is the leading edge of change. They are the border zone between warm and cold air. There are two types of fronts: Warm fronts occur when warm air is pushed into a cold air mass. These are very rare in Australia. They result in drizzle and light rain over a few days. http://www.rnli.org.uk/upload/complete_eCD/fscommand/pop_up_safety.htm Go into sailing and search for weather fronts FRONTS
Cold fronts are far more common in Australia and occur when cold air is pushed into a warm air mass. This forces the warm air to rise causing a number of changes:(a) Decrease in temperature: cold air replaces warm air.(b) Change in wind direction and sometimes speed.(c) Build up of cumulonimbus or rain bearing clouds.(d) Increase in humidity: corresponding to a build up of clouds.(e) Probability of rain. Make up an acronym to remember these changes.
Temperature and humidity: • are related to the wind. Winds pick up the characteristics of where they form – sea or land – these are called source regions Remember: • Winds off the land are generally hotter and drier. • Winds off the sea tend to be cooler and wetter (greater moisture = greater humidity).
Humidity • Humidity is the amount of water vapour in the atmosphere • A high humidity means there is a lot of water vapour, and a low humidity means a little. • The humidity level varies with temperature. The warmer air is, the more moisture the air can hold as vapour. The colder the air is, the less moisture the air can hold. • Humidity is measured as a percentage, relative to the saturation point where the air can hold no more water vapour (i.e. 100 percent humidity).
http://www.youtube.com/watch?v=RkgThul2El8 Types of rainfall: Convection
Types of rainfall: Orographic http://www.youtube.com/watch?v=BVykQfRC_aI http://www.radioblogclub.com/open/51998/elevation_u2/U2_-_Elevation
The air mass is forced to rise as it hits the mountain and condenses into clouds Orographic Rainfall The air mass, now drier, flows down the leeward side of the mountains Warm moist air approaches a mountain barrier Orographic rainfall occurs on the windwardside of the mountains The dry air mass becomes warmer, with little chance of rain. Deserts are often found on the leeward side of large mountain ranges
Types of rainfall: Frontal http://www.youtube.com/watch?v=D88dYNFyBq8 http://www.bbc.co.uk/schools/gcsebitesize/geography/weather/elementsofweatherrev6.shtml