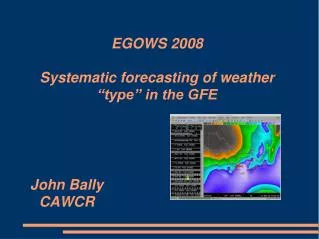
Understanding Weather Forecasting: Tools and Techniques Used by Meteorologists
This article explores the science of weather forecasting, detailing how meteorologists rely on advanced supercomputer models to predict weather patterns. It outlines the essential tools and sources of data used in making forecasts, including surface observations from weather stations, weather balloons carrying radiosondes, and satellite imagery. Various instruments, such as barometers and anemometers, play a critical role in measuring atmospheric conditions. Readers will learn about weather terminology, how forecasts are made, and how to conduct a simple weather forecasting activity.

Understanding Weather Forecasting: Tools and Techniques Used by Meteorologists
E N D
Presentation Transcript
Weather Forecasting & Maps • Meteorologists make forecasts based on models that are produced by supercomputers which perform a large amount of calculations based upon a selection of equations. • These models use information from: • 1) Surface Observations (weather stations – barometer, anemometer, ships, buoys, radar stations) • 2) Weather Balloons (carries radiosondes) • 3) Satellite Information (takes pictures)
Currently, the average model uses cubes with side lengths of 50 km
Weather Balloons are sent out twice a day around the world at exactly the same time 0:00 and 12:00 UTC (8 am and 8pm our time) Radiosonde: a specialized piece of equipment that collects data such as temperature, humidity, pressure, elevation, wind-direction and speed.
Anemometer • An instrument that measures the wind speed. (km/hr) • Barometer • A scientific instrument used to measure atmospheric pressure. (mb) • LOW – is a sign of inclement/bad weather • HIGH – is a sign of fair weather • Furthermore, the faster the pressure drops, the more intense the storm is likely to be.
More Terminology Radar Imagery – uses radio waves to detect, locate, and measure the amount of precipitation in the clouds. Satellite Imagery – pictures taken from space that are used to observe clouds and in particular storm systems ** Very useful for hurricanes … (70 % of earth’s surface is water) …otherwise very difficult to gather surface information. Infrared Satellite Imagery Low clouds – (warmer and emits more infrared energy)…denoted gray High clouds – (colder and emits less infrared energy)…denoted white, or orange Result: can easily pick out stormy weather (zones of thick, heavy clouds) Front– the leading edge of an air mass Isobars – lines on a weather map of equal pressure (the contour lines of weather maps)
Weather Sources. Environment Canada Visit: http://www.weatheroffice.gc.ca/canada_e.html 2) The Weather Network Visit: http://www.theweathernetwork.com/ 3) Surface observation map Visit: http://meteocentre.com/analyse/map.php?date=0&lang=fr&map=AmeriqueduNord&size=large 4) Computer Model Forecasts Visit: http://wxforecaster.com/ncep/java/new/test/all.html
5) NumericalWeather Model Predictions http://spotwx.com/ 6) Accu Weather http://www.accuweather.com/en/ca/canada-weather
Weather Forecast Homework activity Choose a three day period. Create your own weather forecast using the resources that I have provided you with. Record the time when you made the forecast. Also, record the weather source(s) that you relied on the most. Do not update it any! ** Do not directly copy a weather forecast on a particular site. Make it your own! After each day, write a short summary of how well you forecasted the weather. (temperature, winds, precipitation, etc.) Conclusion. At the end, summarize your experience as a meteorologist. Do you understand their job responsibilities more? Were there models that you used that seemed to be more accurate than others? Were your short term forecasts more accurate than your long range forecasts? Why or why not?
Weather map of a storm from 1993. ** The closer the isobars – the faster the wind speed!