Atmospheric Composition and Contour Weather Maps
250 likes | 504 Vues
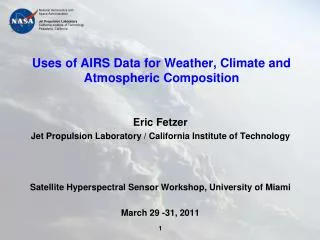
Atmospheric Composition and Contour Weather Maps. Val Bennington AOS 101 September, 2008. Station Map Review. Atmospheric Composition. How does temp change as we go up in the atmosphere? Why? What makes up the atmosphere? Where do these species reside?. Temperature in Atmosphere.

Atmospheric Composition and Contour Weather Maps
E N D
Presentation Transcript
Atmospheric Composition andContour Weather Maps Val Bennington AOS 101 September, 2008
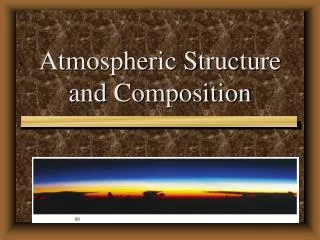
Atmospheric Composition • How does temp change as we go up in the atmosphere? • Why? • What makes up the atmosphere? Where do these species reside?
What’s in the Atmosphere? • Nitrogen (78%) • Oxygen (21%) • Argon (1%) • Water vapor (0-4%) • CO2 (380 ppm) • Ozone (O3) – (4 ppb) • Methane (CH4) – (1.7 ppm) • CFCs
Questions Where is the ozone layer? Why does temp go up in the stratosphere? What level are we usually talking about when we talk about weather? Where is most of the water vapor? Why is it hard to breathe at high altitudes if it is still 21% oxygen??
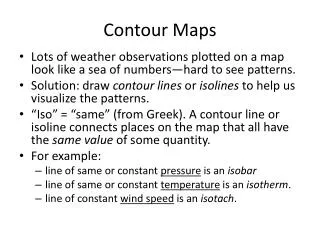
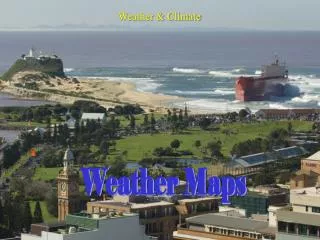
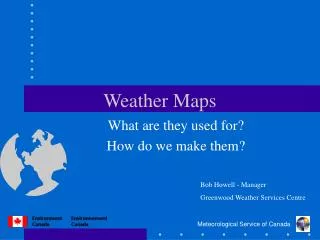
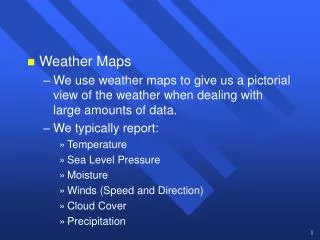
Why Contour? • Contour maps organize all the available data so we can make sense of it • We have all that station map data!!!! Let’s use it. Let’s be able to forecast from it! • Once contoured, you can determine wind direction, high and low pressure systems, locations of possible precipitation, fronts, regions of strong winds and changing temperatures --- ALL FROM A MAP!
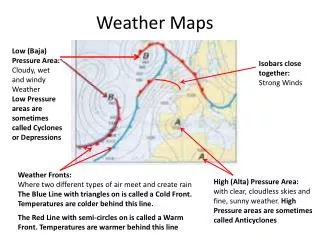
What They Tell Us • Regions of High and Low Pressure • Fronts • Temperature • Wind Direction and Speed • How your weather is going to change!
How to Think about Contouring • Like topographic map • Lines of constant height in this picture • Walk along one of these lines -- stay at exactly the same altitude the ENTIRE time
What Else Do We Contour? • Isopleth is a line on a map that connects all the points of a given variable with the SAME SPECIFIED VALUE • Isobar - line of constant pressure • Isotherm - line of constant temperature • Isotach - line of constant wind speed • Isodrosotherm -a line of constant dewpoint • Isohyet -a line of constant precipitation accumulation • Isoneph -a line of constant cloudiness • Isohaline -a line of constant salinity (saltiness in the ocean) • Isoheight -a line of constant height
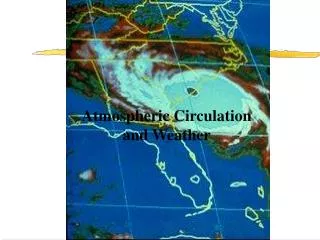
Isobars in Blue (lines of constant pressure) Can you spot Hurricane Ike???
Which Way Do the Winds Go? Geostrophy
Notes about Isobars • Closeness of lines tells us how strong pressure gradient force (PGF) is • Very close lines = great pressure difference over small distance ----> large PGF! **Think of topographic map ** Steep terrain where lines close together ** Here: large PGF when lines close together = Big Force
Contouring Rules • Contours never cross each other • A contour line has values higher than the line value on one side and values lower on the other side of it • Isotherm of 10°F has temps below 10°F on one side and temps above 10°F on the other • Contours are only drawn where there is data! • Evenly spaced increments are always used (say every 5 degrees and every 4 mb for pressure) • Easiest to find a high or low value first and work from there
Examples • Temperature observations • Where do we draw the 15°F isotherm????
Examples • Temperature observations • Where do we draw the 15°F isotherm????
Examples • Temperature observations • Where should we draw the 75ºF and 80ºF isotherms? • Where should we draw the 75F and 80F isotherms?
Examples • Temperature observations • Where should we draw the 75ºF and 80ºF isotherms? • Where should we draw the 75F and 80F isotherms?
New Times • In the olden days, all weather maps and contour maps were done by hand! • Now, computers draw contour maps and determine wind direction and speed - as well as many other things • Contouring is very tedious - so you will only be asked to do simple contouring