Download
1 / 22
220 likes | 380 Vues
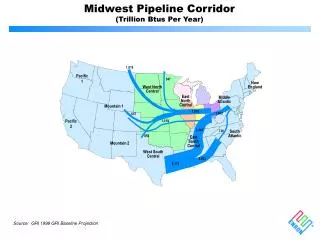
Midwest Pipeline Corridor (Trillion Btus Per Year). 1,019. Pacific 1. 547. New England. West North Central. East North Central. Middle Atlantic. Mountain 1. 1,898. 1,462. 657. Pacific 2. 1,314. 3,346. 736. South Atlantic. 656. East South Central. Mountain 2.

E N D
Midwest Pipeline Corridor (Trillion Btus Per Year) 1,019 Pacific 1 547 New England West North Central East North Central Middle Atlantic Mountain 1 1,898 1,462 657 Pacific 2 1,314 3,346 736 South Atlantic 656 East South Central Mountain 2 West South Central 2,603 6,117 Source: GRI 1999 GRI Baseline Projection
Strategic Market Area Hub Sable Island 6.4 TCF Market East Canada Dawn Wisconsin Malin New York Michigan Chicago Ohio Indiana San Juan SoCal Permian Mobile Bay Henry Hub
Natural Gas Marketed Production by State, 1999 Midwest region represents 14.0% (2.7 TCF) of total U.S. marketed production Source: EIA Natural Gas Annual 1999
Natural Gas Consumption by State, 1999 Midwest region represents 26.9% (5.9 TCF) of total U.S. consumption Source: EIA Natural Gas Annual 1999
Central Region Origination West North Central East North Central >180 Customers 432 BCF Annual Consumption >200 Customers 2.11 TCF Annual Consumption >400 Customers 620 BCF Annual Consumption >300 Customers 1.41 TCF Annual Consumption >250 Customers 1.41 TCF Annual Consumption >800 Customers 1.09 TCF Annual Consumption
Central Region Origination Chris Meyer Staff Commercial Current – Sylvia Pollan, Deirdre McCaffrey, Russell Murrell, Chris Meyer Vacant – 4 Staff Support Vacant – 3
Midwest • Geographic Region consists of 14 States & 1 Canadian Province • West North Central - North Dakota, South Dakota, Nebraska, Kansas, Oklahoma, Minnesota, Iowa, Missouri, Arkansas • East North Central - Wisconsin, Illinois, Michigan, Indiana, Ohio, East Canada • Over 2000 Gas Commodity Customers • Customers Represent: Utilities, Industrials, Producers, Municipals, Gas Fired Generators, Retail Providers • Midwest Region Represents 2.7 tcf of total Marketed Production (14.0%) • Midwest Region represents 5.9 tcf of total Consumption (26.9%)
Midwest Customer Base Largest 6 Nicor Gas – Illinois Peoples Gas - Illinois NIPSCO – Indiana Consumers Energy – Michigan Michcon – Michigan East Ohio Gas – Ohio Represent > 2.5 TCF in Market of 5.9 TCF
Origination Customer Coverage Midwest Divided into Two Regions • West North Central • Import (Canadian) Transmission Corridor • Producer weighted (Oklahoma/Kansas) • Municipal Environment • Strategic area for upstream shortages into Northern Border and NNG • East North Central • Significant consumption market area • Corridor to the North East • Dramatically changing supply/market dynamic due to infra-structure • Gas fired generation will test hourly limits of current infra-structure • Strategic focus for a Market area Hub • Molecular network connecting Canada, Chicago, and Michigan to the Northeast
Origination Customer Coverage (Cont.) Customer Coverage • Regional Focus • West North Central • East North Central • Business Unit by States • Ownership of all gas commodity coverage transactions • Strategy development and implementation • Macro/Micro business Analysis • Develops connected platform market to customer, customer to environment, environment to intra-state infrastructure, state to region, and region to North America. • Information platform benefits trading, customer strategy formulation and overall ENA business. • State Team led by Originator • Alignment with Trading Desk • Focused ownership of Market Dynamic-Cause and Effect • Market Fundamentals vs. technical analysis • Teams own responsibility for P/L, customer and product development • Aggregate and Leverage to Customer Environment: Trading, Origination, Regulatory, Transportation and Structuring
Competitive Analysis Regulatory Fundamental Research NEED: • Comprehensive fundamental research providing regulatory market framework • Creates & Supports • Formulation of New Gas Commodity Business Model • Potential to implement with strategic customers • Platform for: • Trading Information • Strategy Development • Regulatory Solutions for Customers
Competitive Analysis Regulatory Fundamental Research (Cont.) All incentive mechanisms or performance based ratemaking either for gas or electric utilities in U.S. • Approved • Pending • Denied All unbundling plans for gas or electric utilities in U.S. • Approved • Pending • Denied All unbundling or incentive plans for monopoly utility companies (Communications, Energy, Cable, etc.) that required commission or legislative approval in: • Illinois • Mid-West • U.S.
Competitive Analysis Regulatory Fundamental Research (Cont.) *6 Month to 1 year Project Based in Chicago
enovate • Wholesale joint venture with Peoples Energy specific to the Chicago market providing natural gas products and services • Hub Products and Service exclusive arrangement for service territories of Peoples Gas, North Shore Gas, Cilco, Nicor Gas, Illinois Power and Nipsco. • Revunue sharing 50% Enron / 50% Peoples Energy
enovate enovate business segments consist of: Wholesale MarketingTrading • Hub Market Based • Transport Products/Services EOL • Utility Intra-Day Peoples GasParking North Shore Hub Lending Strategic InitiativesAsset Growth • PEC Asset Acquisition • Storage Monetization Asset Investment • Base Rate Products Contractual Rights • Incentive Mechanism • Unbundling Strategies • Fundamental information flow
Competitive Analysis Groups Market Based Fundamental Support Chicago Portal Market Area Newsletter • Sweeps pipelines – ofo’s, scheduled work, etc. • Chicago weather today and forecast • Basis view • Fundamental physical predictions • Market News • Sweeps newswires • Storage Report/Analysis Provides • Market eyes • One Stop • Ability to get return customer traction • Have dialogue with Customer Groups
enovate - Chicago Houston Structuring Houston Economics/ Risk Control CS: Commercial Staff
Coverage Metrics – Coverage Year 2001 *** Percentages are calculated as a percent of the total number of accounts