Download
1 / 31
310 likes | 344 Vues
Explore the rise in obesity rates among U.S. adults from 1985 to 2010 using CDC data. Witness the concerning shift in BMI levels over the years.

E N D
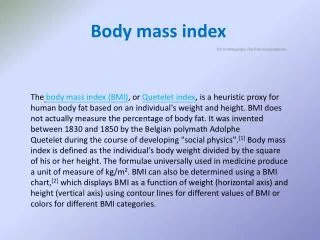
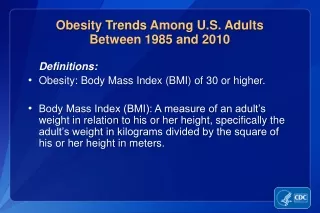
Obesity Trends Among U.S. Adults Between 1985 and 2010 • Definitions: • Obesity: Body Mass Index (BMI) of 30 or higher. • Body Mass Index (BMI): A measure of an adult’s weight in relation to his or her height, specifically the adult’s weight in kilograms divided by the square of his or her height in meters.
Obesity Trends Among U.S. Adults Between 1985 and 2010 • Source of the data: • The data shown in these maps were collected through CDC’s Behavioral Risk Factor Surveillance System (BRFSS). Each year, state health departments use standard procedures to collect data through a series of telephone interviews with U.S. adults. Height and weight data are self-reported. • Prevalence estimates generated for the maps may vary slightly from those generated for the states by BRFSS (http://aps.nccd.cdc.gov/brfss) as slightly different analytic methods are used.
In 1990, among states participating in the Behavioral Risk Factor Surveillance System, 10 states had a prevalence of obesity less than 10% and no state had prevalence equal to or greater than 15%. • By 2000, no state had a prevalence of obesity less than 10%, 23 states had a prevalence between 20–24%, and no state had prevalence equal to or greater than 25%. • In 2010, no state had a prevalence of obesity less than 20%. Thirty-six states had a prevalence equal to or greater than 25%; 12 of these states (Alabama, Arkansas, Kentucky, Louisiana, Michigan, Mississippi, Missouri, Oklahoma, South Carolina, Tennessee, Texas, and West Virginia) had a prevalence equal to or greater than 30%.
Citations • Mokdad AH, et al. The spread of the obesity epidemic in the United States, 1991–1998. JAMA 1999;282:16:1519–22. • Mokdad AH, et al. The continuing epidemics of obesity and diabetes in the United States. JAMA 2001;286:10:1519–22. • Mokdad AH, et al. Prevalence of obesity, diabetes, and obesity-related health risk factors, 2001. JAMA 2003;289:1:76–9. • CDC. State-specific prevalence of obesity among adults — United States, 2005. MMWR 2006;55(36):985–8. • CDC. State-specific prevalence of obesity among adults — United States, 2007. MMWR 2008;57(28):765–8. • CDC. Vital signs: State-specific prevalence of obesity among adults — United States, 2009. MMWR 2010;59:1–5.
Obesity Trends* Among U.S. AdultsBRFSS,1990, 2000, 2010 (*BMI 30, or about 30 lbs. overweight for 5’4” person) 2000 1990 2010 No Data <10% 10%–14% 15%–19% 20%–24% 25%–29% ≥30%
Obesity Trends* Among U.S. AdultsBRFSS, 1985 (*BMI ≥30, or ~ 30 lbs. overweight for 5’ 4” person) No Data <10% 10%–14%
Obesity Trends* Among U.S. AdultsBRFSS, 1986 (*BMI ≥30, or ~ 30 lbs. overweight for 5’ 4” person) No Data <10% 10%–14%
Obesity Trends* Among U.S. AdultsBRFSS, 1987 (*BMI ≥30, or ~ 30 lbs. overweight for 5’ 4” person) No Data <10% 10%–14%
Obesity Trends* Among U.S. AdultsBRFSS, 1988 (*BMI ≥30, or ~ 30 lbs. overweight for 5’ 4” person) No Data <10% 10%–14%
Obesity Trends* Among U.S. AdultsBRFSS, 1989 (*BMI ≥30, or ~ 30 lbs. overweight for 5’ 4” person) No Data <10% 10%–14%
Obesity Trends* Among U.S. AdultsBRFSS, 1990 (*BMI ≥30, or ~ 30 lbs. overweight for 5’ 4” person) No Data <10% 10%–14%
Obesity Trends* Among U.S. AdultsBRFSS, 1991 (*BMI ≥30, or ~ 30 lbs. overweight for 5’ 4” person) No Data <10% 10%–14% 15%–19%
Obesity Trends* Among U.S. AdultsBRFSS, 1992 (*BMI ≥30, or ~ 30 lbs. overweight for 5’ 4” person) No Data <10% 10%–14% 15%–19%
Obesity Trends* Among U.S. AdultsBRFSS, 1993 (*BMI ≥30, or ~ 30 lbs. overweight for 5’ 4” person) No Data <10% 10%–14% 15%–19%
Obesity Trends* Among U.S. AdultsBRFSS, 1994 (*BMI ≥30, or ~ 30 lbs. overweight for 5’ 4” person) No Data <10% 10%–14% 15%–19%
Obesity Trends* Among U.S. AdultsBRFSS, 1995 (*BMI ≥30, or ~ 30 lbs. overweight for 5’ 4” person) No Data <10% 10%–14% 15%–19%
Obesity Trends* Among U.S. AdultsBRFSS, 1996 (*BMI ≥30, or ~ 30 lbs. overweight for 5’ 4” person) No Data <10% 10%–14% 15%–19%
Obesity Trends* Among U.S. AdultsBRFSS, 1997 (*BMI ≥30, or ~ 30 lbs. overweight for 5’ 4” person) No Data <10% 10%–14% 15%–19% ≥20%
Obesity Trends* Among U.S. AdultsBRFSS, 1998 (*BMI ≥30, or ~ 30 lbs. overweight for 5’ 4” person) No Data <10% 10%–14% 15%–19% ≥20%
Obesity Trends* Among U.S. AdultsBRFSS, 1999 (*BMI ≥30, or ~ 30 lbs. overweight for 5’ 4” person) No Data <10% 10%–14% 15%–19% ≥20%
Obesity Trends* Among U.S. AdultsBRFSS, 2000 (*BMI ≥30, or ~ 30 lbs. overweight for 5’ 4” person) No Data <10% 10%–14% 15%–19% ≥20%
Obesity Trends* Among U.S. AdultsBRFSS, 2001 (*BMI ≥30, or ~ 30 lbs. overweight for 5’ 4” person) No Data <10% 10%–14% 15%–19% 20%–24% ≥25%
Obesity Trends* Among U.S. AdultsBRFSS, 2002 (*BMI ≥30, or ~ 30 lbs. overweight for 5’ 4” person) No Data <10% 10%–14% 15%–19% 20%–24% ≥25%
Obesity Trends* Among U.S. AdultsBRFSS, 2003 (*BMI ≥30, or ~ 30 lbs. overweight for 5’ 4” person) No Data <10% 10%–14% 15%–19% 20%–24% ≥25%
Obesity Trends* Among U.S. AdultsBRFSS, 2004 (*BMI ≥30, or ~ 30 lbs. overweight for 5’ 4” person) No Data <10% 10%–14% 15%–19% 20%–24% ≥25%
Obesity Trends* Among U.S. AdultsBRFSS, 2005 (*BMI ≥30, or ~ 30 lbs. overweight for 5’ 4” person) No Data <10% 10%–14% 15%–19% 20%–24% 25%–29% ≥30%
Obesity Trends* Among U.S. AdultsBRFSS, 2006 (*BMI ≥30, or ~ 30 lbs. overweight for 5’ 4” person) No Data <10% 10%–14% 15%–19% 20%–24% 25%–29% ≥30%
Obesity Trends* Among U.S. AdultsBRFSS, 2007 (*BMI ≥30, or ~ 30 lbs. overweight for 5’ 4” person) No Data <10% 10%–14% 15%–19% 20%–24% 25%–29% ≥30%
Obesity Trends* Among U.S. AdultsBRFSS, 2008 (*BMI ≥30, or ~ 30 lbs. overweight for 5’ 4” person) No Data <10% 10%–14% 15%–19% 20%–24% 25%–29% ≥30%
Obesity Trends* Among U.S. AdultsBRFSS, 2009 (*BMI ≥30, or ~ 30 lbs. overweight for 5’ 4” person) No Data <10% 10%–14% 15%–19% 20%–24% 25%–29% ≥30%
Obesity Trends* Among U.S. AdultsBRFSS, 2010 (*BMI ≥30, or ~ 30 lbs. overweight for 5’ 4” person) No Data <10% 10%–14% 15%–19% 20%–24% 25%–29% ≥30%