U.S. & World Cotton Economic Outlook September 2013
490 likes | 590 Vues
Comprehensive analysis of U.S. & world cotton markets with supply, demand, production stats, and key economic indicators. Includes insights on cotton futures, retail consumption, exports, and global trade dynamics.

U.S. & World Cotton Economic Outlook September 2013
E N D
Presentation Transcript
U.S. and World Cotton Economic OutlookSeptember 2013Prepared by:Economic ServicesNational Cotton Council
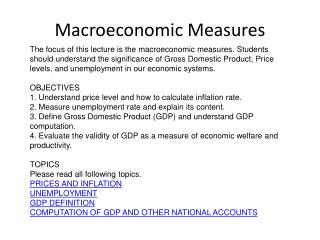
Macroeconomic Environment
U.S. Federal Budget Surplus (CBO Projection)
Real GDP Growth in Selected Countries
Real Exchange Rate Index(Other Important Trade Partners) Federal Reserve
2013 U.S. Cotton Area Thousand Acres * USDA
2013 U.S. Cotton Area Thousand Hectares * USDA
U.S. Cotton Mill Use (Calendar Year)
U.S. Cotton Mill Use (Marketing Year)
The World Market & U.S. Cotton Exports
World Fiber Mill Use *PCI
U.S. Supply and DemandMillion Bales Beginning Stocks 3.35 3.90 Production 17.32 12.90 Imports 0.01 0.01 Total Supply 20.68 16.81 Mill Use 3.50 3.50 Exports 13.03 10.40 Total Offtake 16.53 13.90 Ending Stocks 3.90 2.90 Stocks-to-Use Ratio 23.6% 20.9% 2012/13e 2013/14p
U.S. Supply and DemandMillion Metric Tons Beginning Stocks 0.73 0.85 Production 3.77 2.81 Imports 0.00 0.00 Total Supply 4.51 3.66 Mill Use 0.76 0.76 Exports 2.84 2.27 Total Offtake 3.60 3.03 Ending Stocks 0.85 0.63 Stocks-to-Use Ratio 23.6% 20.9% 2012/13e 2013/14p
World Supply and DemandMillion Bales Beginning Stocks 71.77 86.04 Production 121.04 117.42 Imports 46.43 38.93 Mill Use 107.27 109.53 Exports 46.74 38.96 Ending Stocks 86.04 94.73 Stocks-to-Use Ratio 80.2% 86.5% 2012/13e 2013/14p
World Supply and DemandMillion Metric Tons Beginning Stocks 15.64 18.75 Production 26.37 25.58 Imports 10.12 8.48 Mill Use 23.37 23.86 Exports 10.18 8.49 Ending Stocks 18.75 20.64 Stocks-to-Use Ratio 80.2% 86.5% 2012/13e 2013/14p
Producers Cooperatives Warehouses Manufacturers Ginners Cottonseed Merchants