Macroeconomic Environment
400 likes | 495 Vues
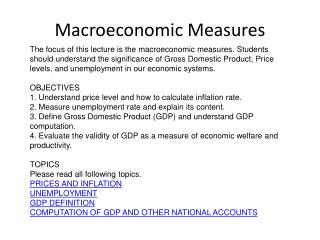
This report by the National Cotton Council highlights U.S. and global cotton trends, includes future pricing, production figures, trade dynamics, and projections for the industry. Stay informed on cotton's market performance and economic forecasts.

Macroeconomic Environment
E N D
Presentation Transcript
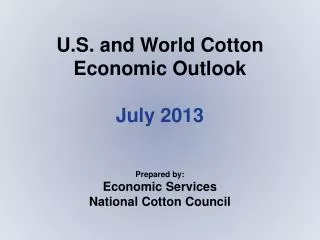
U.S. and World Cotton Economic OutlookJanuary 2011Prepared by:Economic ServicesNational Cotton Council
December Cotton Futures Cents per Pound
December Corn Futures Cents per Bushel
November Soybean Futures Cents per Bushel
2010 U.S. Cotton Plantings Thousand Acres 2009 2010 % Actual Estimated* Change Southeast 1,891 2,597 37.3 Mid-South 1,627 1,920 18.0 Southwest 5,243 5,886 12.3 West 247 366 48.1 ALL UPLAND9,00810,76919.5 ALL ELS 141 204 44.4 ALL COTTON 9,150 10,973 19.9 *USDA June Acreage Report - Revised
2010 U.S. Cotton Plantings Thousand Hectares 2009 2010 % Actual Estimated* Change Southeast 765 1,051 37.3 Mid-South 658 777 18.0 Southwest 2,122 2,382 12.3 West 100 148 48.1 ALL UPLAND3,6454,35819.5 ALL ELS 57 83 44.4 ALL COTTON 3,703 4,441 19.9 *USDA June Acreage Report - Revised
U.S. Cotton Retail Consumption 2010 2009
U.S. Cotton Mill Use 2010 2009
World Fiber Mill Use *PCI
U.S. Supply and DemandMillion Bales Beginning Stocks 6.34 2.95 Production 12.19 18.32 Imports 0.00 0.01 Total Supply 18.53 21.27 Mill Use 3.46 3.60 Exports 12.04 15.75 Total Offtake 15.50 19.35 Ending Stocks 2.95 1.90 Stocks-to-Use Ratio 19.0% 9.8% 2009/10e 2010/11p
U.S. Supply and DemandMillion Metric Tons Beginning Stocks 1.38 0.64 Production 2.66 3.99 Imports 0.00 0.00 Total Supply 4.04 4.63 Mill Use 0.75 0.78 Exports 2.62 3.43 Total Offtake 3.38 4.22 Ending Stocks 0.64 0.41 Stocks-to-Use Ratio 19.0% 9.8% 2009/10e 2010/11p
World Supply and DemandMillion Bales 2009/10e 2010/11p Beginning Stocks 60.52 43.85 Production 101.54 115.46 Imports 35.88 38.32 Mill Use 118.52 116.58 Exports 35.60 38.35 Ending Stocks 43.85 42.84 Stocks-to-Use Ratio 37.0% 36.7%
World Supply and DemandMillion Metric Tons 2009/10e 2010/11p Beginning Stocks 13.19 9.55 Production 22.12 25.15 Imports 7.82 8.35 Mill Use 25.82 25.40 Exports 7.76 8.36 Ending Stocks 9.55 9.33 Stocks-to-Use Ratio 37.0% 36.7%
Producers Cooperatives Warehouses Manufacturers Ginners Cottonseed Merchants