Download
1 / 27
270 likes | 415 Vues
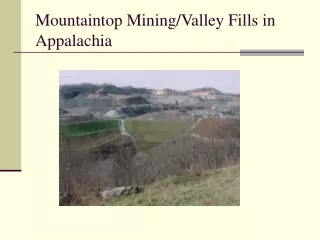
Hydrologic Issues in Mountaintop Mining Areas. Ronald Evaldi, USGS-WSC, Charleston, WV Daniel Evans, USGS-WSC, Louisville, KY Hugh Bevans, USGS-WSC, Charleston, WV. “ The bitterest environmental debate in the state’s history”– Sunday Gazette-Mail, Sept. 22, 2002.

E N D
Hydrologic Issues in Mountaintop Mining Areas Ronald Evaldi, USGS-WSC, Charleston, WV Daniel Evans, USGS-WSC, Louisville, KY Hugh Bevans, USGS-WSC, Charleston, WV
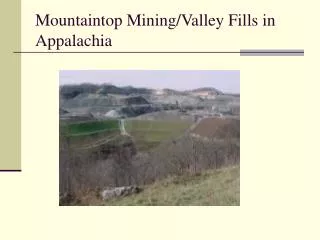
“The bitterest environmental debate in the state’s history”–Sunday Gazette-Mail, Sept. 22, 2002 10% of US coal is produced from Central Appalachian coalfield surface mines, mostly by mountaintop mining >91,000 acres of valley fills in WV, KY, VA, and TN 1999 Federal court settlement required regulatory agencies to prepare an EIS on mountaintop mining, including effects on water resources
EIS Notes on Loss of Headwater Streams • Intermittent and ephemeral headwater streams are largely responsible for maintaining water quality, quantity, & sediment control. • Headwaters serve as a major area of nutrient transformation and retention, and when removed, downstream biological communities are affected for considerable distances.
Court Ruling—Placement of valley-fill material only in ephemeral streams, and not within 100 ft of intermittent and perennial streams.
Median drainage area of 14.5 acres for 34 origin sites of intermittent streamflow. Ranged from 6.3 to 45.3 acres Medians for 2000 and 2001 varied by 3.4 acres Median drainage area of 40.8 acres for 20 origin sites of perennial streamflow. Ranged from 10.4 to 150 acres Medians for 2000 and 2001 varied by 18.0 acres Results
Results • Stream-bed materials below valley fills had smaller median particle sizes than below mined sites without valley fills and below unmined sites. • Stream-water temperature below a valley fill exhibited less daily and seasonal variation than below an unmined basin. • The 90-% streamflow duration values (streamflow exceeded 90% of the time) below valley fills were 6 to 7 times greater than below unmined basins • Unmined basin outflow was 59% base flow, mined basin outflow was 84% base flow.
Results • Mined basin had greater total flow • Unit daily mean flow was twice that of unmined basin. • Proportional difference was greatest at low flow. • Mined site flowed entire period; unmined site went dry. • Unit peak flows were greater in the mined basin for rainfall intensities >one inch per hour; but were less for rainfall intensities <one inch per hour. • Peak flows in the mined basin exceeded the 5-yr recurrence interval several times; but in the unmined basin, did not exceed bank-full stage (1.3-yr recurrence interval).
MT65C--active surface mine, 1 reclaimed valley fill, and 1 unreclaimed valley fill MT66--active surface mine and 2 reclaimed valley fills MT76--1 reclaimed valley fill USGS1, USGS2, and USGS3--no surface mining activities
Results When peak discharge at unmined sites was >10-yr recurrence interval, unit flows were greater at sites with valley fills. When peak discharge at unmined sites was <10-yr recurrence interval, unit flows were greater at unmined sites. USACE model predicted peak flows increase during mining, decrease but >pre-mining after reclamation, and decrease to <pre-mining after reforestation. WVDEP model predicted that mountaintop mining increases peak flows 3 to 21%.
Long-Term Monitoring • Monitor small basins (0.1 to 100 mi2) to provide data for defining background conditions, permitting mining, and assessing changes during mining, reclamation, and reforestation. • Precipitation and atmospheric deposition • Streamflow • Water temperature • Water chemistry • Sediment • Fluvial geomorphology • Aquatic ecology
Streamflow models to predict changes in flow during mining, reclamation, and reforestation. Aquatic ecology studies to evaluate changes in aquatic communities related to changes in stream energy budgets, water temperatures, flow regimes, and habitats. Ground-water flow studies to determine recharge, movement, and discharge of ground water. Water budget studies to assess impacts on the availability of water resources. Hydrologic setting evaluations for post-mining land use. Water-quality issues such as suspended sediment and selenium. Studies
Selenium • An EPA study conducted as part of the Mountaintop Mining/Valley Fill EIS found that selenium in streams below valley fills exceeded the aquatic wildlife standard of 5 mg/L. • These findings resulted in the listing of 9 streams on WVDEP’s 2002 Section 303(d) list of impaired streams.
Selenium • USFWS analyzed fish tissues collected downstream from mountaintop mining areas. • Selenium was present in all sampled tissues. • At several locations Se in tissues exceeded 4 mg/kg (ppm), a concentration that can result in reproductive failure and juvenile mortality. • Se in some tissues approached 7 mg/kg, a concentration that can result in reproductive failure in birds consuming these tissues.
Selenium • USGS has a large data base of Se concentrations in coal measures. • Coal beds targeted by mountaintop mining are enriched in Se compared to coal beds both lower and higher in the geologic sequence. • Other rocks in this sequence may also be enriched in Se.
Selenium Questions • How is Se leached from valley fills? • Contributions of different source rocks • Forms (selenite vs. selenate) • Decay function? • How does Se partition and cycle between dissolved and suspended phases and forms in streams and lakes? • How does Se bioaccumulate through the food web? • Is Se harming wildlife? • Is Se a threat to humans? • How can Se be managed or remediated?