Analyzing RadViz Data: Similarity and Correlation Visualizations
180 likes | 311 Vues
This analysis showcases various visualizations generated from the RadViz method using a set of data points from `cor-test.csv`. The visualizations focus on similarities based on Pearson correlation, absolute similarities, and correlation values, each mode providing insights into the relationships within the dataset. Different sorting methods (ascending, descending, random) are applied to highlight contrasting views. Additionally, the importance of normalization and color scaling is emphasized for better interpretation of the visual results.

Analyzing RadViz Data: Similarity and Correlation Visualizations
E N D
Presentation Transcript
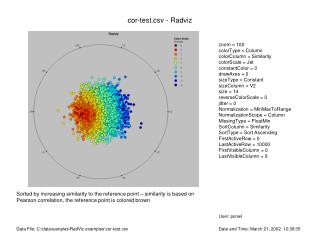
cor-test.csv - Radviz zoom = 100 colorType = Column colorColumn = Similarity colorScale = Jet constantColor = 0 drawAxes = 0 sizeType = Constant sizeColumn = V2 size = 14 reverseColorScale = 0 jitter = 0 Normalization = MinMaxToRange NormalizationScope = Column MissingType = FloatMin SortColumn = Similarity SortType = Sort Ascending FirstActiveRow = 0 LastActiveRow = 10000 FirstVisibleColumn = 0 LastVisibleColumn = 9 Sorted by increasing similarity to the reference point – similarity is based on Pearson correlation, the reference point is colored brown User: poneil Data File: C:\data\samples\RadViz examples\cor-test.csv Date and Time: March 21, 2002 12:36:35
cor-test.csv - Radviz zoom = 100 colorType = Column colorColumn = Similarity colorScale = Jet constantColor = 0 drawAxes = 0 sizeType = Constant sizeColumn = V2 size = 14 reverseColorScale = 0 jitter = 0 Normalization = MinMaxToRange NormalizationScope = Column MissingType = FloatMin SortColumn = Similarity SortType = Sort Descending FirstActiveRow = 0 LastActiveRow = 10000 FirstVisibleColumn = 0 LastVisibleColumn = 9 Sorted by decreasing similarity User: poneil Data File: C:\data\samples\RadViz examples\cor-test.csv Date and Time: March 21, 2002 12:37:20
cor-test.csv - Radviz zoom = 100 colorType = Column colorColumn = Similarity colorScale = Jet constantColor = 0 drawAxes = 0 sizeType = Constant sizeColumn = V2 size = 14 reverseColorScale = 0 jitter = 0 Normalization = MinMaxToRange NormalizationScope = Column MissingType = FloatMin SortColumn = Similarity SortType = Sort Random FirstActiveRow = 0 LastActiveRow = 10000 FirstVisibleColumn = 0 LastVisibleColumn = 9 Random sort User: poneil Data File: C:\data\samples\RadViz examples\cor-test.csv Date and Time: March 21, 2002 12:37:43
cor-test.csv - Radviz zoom = 100 colorType = Column colorColumn = Abs sim colorScale = Jet constantColor = 0 drawAxes = 0 sizeType = Constant sizeColumn = V2 size = 14 reverseColorScale = 0 jitter = 0 Normalization = MinMaxToRange NormalizationScope = Column MissingType = FloatMin SortColumn = Abs sim SortType = Sort Ascending FirstActiveRow = 0 LastActiveRow = 10000 FirstVisibleColumn = 0 LastVisibleColumn = 9 Color scale changed to absolute value of similarity -- sorted in increasing order User: poneil Data File: C:\data\samples\RadViz examples\cor-test.csv Date and Time: March 21, 2002 12:40:00
cor-test.csv - Radviz zoom = 100 colorType = Column colorColumn = Abs sim colorScale = Jet constantColor = 0 drawAxes = 0 sizeType = Constant sizeColumn = V2 size = 14 reverseColorScale = 0 jitter = 0 Normalization = MinMaxToRange NormalizationScope = Column MissingType = FloatMin SortColumn = Abs sim SortType = Sort Descending FirstActiveRow = 0 LastActiveRow = 10000 FirstVisibleColumn = 0 LastVisibleColumn = 9 Sorted in decreasing order of absolute similarity User: poneil Data File: C:\data\samples\RadViz examples\cor-test.csv Date and Time: March 21, 2002 12:40:49
cor-test.csv - Radviz zoom = 100 colorType = Column colorColumn = Abs sim colorScale = Jet constantColor = 0 drawAxes = 0 sizeType = Constant sizeColumn = V2 size = 14 reverseColorScale = 0 jitter = 0 Normalization = MinMaxToRange NormalizationScope = Column MissingType = FloatMin SortColumn = Abs sim SortType = Sort Random FirstActiveRow = 0 LastActiveRow = 10000 FirstVisibleColumn = 0 LastVisibleColumn = 9 Random sort User: poneil Data File: C:\data\samples\RadViz examples\cor-test.csv Date and Time: March 21, 2002 12:41:24
cor-test.csv - Radviz zoom = 100 colorType = Column colorColumn = Correlation colorScale = Jet constantColor = 0 drawAxes = 0 sizeType = Constant sizeColumn = V2 size = 14 reverseColorScale = 0 jitter = 0 Normalization = MinMaxToRange NormalizationScope = Column MissingType = FloatMin SortColumn = Correlation SortType = Sort Ascending FirstActiveRow = 0 LastActiveRow = 10000 FirstVisibleColumn = 0 LastVisibleColumn = 9 Colored and sorted by correlation value User: poneil Data File: C:\data\samples\RadViz examples\cor-test.csv Date and Time: March 21, 2002 12:45:00
Boundaries3.csv - Radviz zoom = 100 colorType = Constant colorColumn = X3 colorScale = Blue to Yellow constantColor = 16711680 drawAxes = 1 sizeType = Constant sizeColumn = X1 size = 14 reverseColorScale = 0 jitter = 0 Normalization = MinMaxToRange NormalizationScope = Column MissingType = FloatMin SortColumn = -1 SortType = -1 FirstActiveRow = 0 LastActiveRow = 26 FirstVisibleColumn = 0 LastVisibleColumn = 2 Standard RadViz boundaries for 3-space User: poneil Data File: C:\data\samples\Lines\Boundaries3.csv Date and Time: March 26, 2002 14:04:15
Boundaries3.csv - Radviz zoom = 100 colorType = Constant colorColumn = X3 colorScale = Blue to Yellow constantColor = 16711680 drawAxes = 1 sizeType = Constant sizeColumn = X1 size = 14 reverseColorScale = 0 jitter = 0 Normalization = MinMaxToRange NormalizationScope = Column MissingType = FloatMin SortColumn = -1 SortType = -1 FirstActiveRow = 0 LastActiveRow = 26 FirstVisibleColumn = 0 LastVisibleColumn = 2 3-space boundaries using Euclidian normalization User: poneil Data File: C:\data\samples\Lines\Boundaries3.csv Date and Time: March 26, 2002 14:05:52
Boundaries4.csv - Radviz zoom = 100 colorType = Constant colorColumn = X4 colorScale = Blue to Yellow constantColor = 16711680 drawAxes = 1 sizeType = Constant sizeColumn = X1 size = 14 reverseColorScale = 0 jitter = 0 Normalization = MinMaxToRange NormalizationScope = Column MissingType = FloatMin SortColumn = -1 SortType = -1 FirstActiveRow = 0 LastActiveRow = 40 FirstVisibleColumn = 0 LastVisibleColumn = 3 Standard boundaries in 4-space User: poneil Data File: C:\data\samples\Lines\Boundaries4.csv Date and Time: March 26, 2002 14:10:17
Boundaries4.csv - Radviz zoom = 100 colorType = Constant colorColumn = X4 colorScale = Blue to Yellow constantColor = 16711680 drawAxes = 1 sizeType = Constant sizeColumn = X1 size = 14 reverseColorScale = 0 jitter = 0 Normalization = MinMaxToRange NormalizationScope = Column MissingType = FloatMin SortColumn = -1 SortType = -1 FirstActiveRow = 0 LastActiveRow = 40 FirstVisibleColumn = 0 LastVisibleColumn = 3 4-space boundaries using Euclidian normalization User: poneil Data File: C:\data\samples\Lines\Boundaries4.csv Date and Time: March 26, 2002 14:09:51
Boundaries5.csv - Radviz zoom = 100 colorType = Constant colorColumn = X5 colorScale = Blue to Yellow constantColor = 16711680 drawAxes = 1 sizeType = Constant sizeColumn = X1 size = 14 reverseColorScale = 0 jitter = 0 Normalization = MinMaxToRange NormalizationScope = Column MissingType = FloatMin SortColumn = -1 SortType = -1 FirstActiveRow = 0 LastActiveRow = 57 FirstVisibleColumn = 0 LastVisibleColumn = 4 Standard boundaries in 5-space User: poneil Data File: C:\data\samples\Lines\Boundaries5.csv Date and Time: March 26, 2002 14:14:47
Boundaries5.csv - Radviz zoom = 100 colorType = Constant colorColumn = X5 colorScale = Blue to Yellow constantColor = 16711680 drawAxes = 1 sizeType = Constant sizeColumn = X1 size = 14 reverseColorScale = 0 jitter = 0 Normalization = MinMaxToRange NormalizationScope = Column MissingType = FloatMin SortColumn = -1 SortType = -1 FirstActiveRow = 0 LastActiveRow = 57 FirstVisibleColumn = 0 LastVisibleColumn = 4 5-space boundaries using Euclidian normalization User: poneil Data File: C:\data\samples\Lines\Boundaries5.csv Date and Time: March 26, 2002 14:17:16
Boundaries5.csv - Radviz zoom = 75 colorType = Constant colorColumn = X5 colorScale = Blue to Yellow constantColor = 16711680 drawAxes = 1 sizeType = Constant sizeColumn = X1 size = 14 reverseColorScale = 0 jitter = 0 Normalization = MinMaxToRange NormalizationScope = Column MissingType = FloatMin SortColumn = -1 SortType = -1 FirstActiveRow = 0 LastActiveRow = 57 FirstVisibleColumn = 0 LastVisibleColumn = 4 At 75% of the original size User: poneil Data File: C:\data\samples\Lines\Boundaries5.csv Date and Time: March 26, 2002 14:18:23
cosineCor-d=10.csv - Radviz zoom = 100 colorType = Column colorColumn = Class colorScale = Jet constantColor = 0 drawAxes = 1 sizeType = Constant sizeColumn = V1 size = 14 reverseColorScale = 0 jitter = 0 Normalization = MinMaxToRange NormalizationScope = ActiveColumns MissingType = FloatMin SortColumn = Cosine Corr. SortType = Sort Ascending FirstActiveRow = 0 LastActiveRow = 10000 FirstVisibleColumn = 0 LastVisibleColumn = 9 10 dimensions, standard mapping, sorted by cosine correlation with reference point User: poneil Data File: C:\data\samples\RadViz examples\cosineCor-d=10.csv Date and Time: March 26, 2002 15:37:52
cosineCor-d=10.csv - Radviz zoom = 75 colorType = Column colorColumn = Class colorScale = Jet constantColor = 0 drawAxes = 1 sizeType = Constant sizeColumn = V1 size = 14 reverseColorScale = 0 jitter = 0 Normalization = MinMaxToRange NormalizationScope = ActiveColumns MissingType = FloatMin SortColumn = Cosine Corr. SortType = Sort Ascending FirstActiveRow = 0 LastActiveRow = 10000 FirstVisibleColumn = 0 LastVisibleColumn = 9 Same using Euclidian normalization, reduced to 75% size User: poneil Data File: C:\data\samples\RadViz examples\cosineCor-d=10.csv Date and Time: March 26, 2002 15:39:40
cosineCor-d=3.csv - Radviz zoom = 100 colorType = Column colorColumn = Class colorScale = Jet constantColor = 0 drawAxes = 1 sizeType = Constant sizeColumn = V1 size = 14 reverseColorScale = 0 jitter = 0 Normalization = MinMaxToRange NormalizationScope = ActiveColumns MissingType = FloatMin SortColumn = Cosine Corr. SortType = Sort Ascending FirstActiveRow = 0 LastActiveRow = 10000 FirstVisibleColumn = 0 LastVisibleColumn = 2 3 dimensions, standard mapping, unsorted, classes reflect cosine correlation User: poneil Data File: C:\data\samples\RadViz examples\cosineCor-d=3.csv Date and Time: March 26, 2002 15:47:39
cosineCor-d=3.csv - Radviz zoom = 100 colorType = Column colorColumn = Class colorScale = Jet constantColor = 0 drawAxes = 1 sizeType = Constant sizeColumn = V1 size = 14 reverseColorScale = 0 jitter = 0 Normalization = MinMaxToRange NormalizationScope = ActiveColumns MissingType = FloatMin SortColumn = Cosine Corr. SortType = Sort Ascending FirstActiveRow = 0 LastActiveRow = 10000 FirstVisibleColumn = 0 LastVisibleColumn = 2 Same using Euclidian normalization User: poneil Data File: C:\data\samples\RadViz examples\cosineCor-d=3.csv Date and Time: March 26, 2002 15:50:00