Exploring Gastric Electrical Activity with Phasors and Capacitors in Low Pass Filter Applications
This article delves into the application of phasors and capacitors in analyzing gastric electrical activity using electrogastrograms. Gastrointestinal disorders affect 60-70 million people, emphasizing the importance of understanding electrical signals in the gut. We explore how slow wave mapping, recorded through a flexible electrode array of 256 electrodes, tracks the spread of electrical activity in the stomach while filtering out noise. By implementing low pass filters, we can improve the clarity of critical signals and their magnitude, fostering advancements in gastrointestinal health monitoring.

Exploring Gastric Electrical Activity with Phasors and Capacitors in Low Pass Filter Applications
E N D
Presentation Transcript
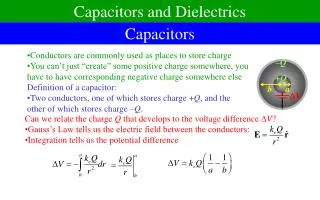
Phasors and Capacitors Spin My World Right Round
LPF Application: Gastric Electrical Activity • 60-70 million people suffer from GI disorder • Electrically active organ http://www.virtualmedicalcentre.com/anatomy/gastrointestinal-system/7
Electrogastrogram and Slow Wave mapping Flexible Electrode Array (256 electrodes) Recording the EGG (6 electrodes) Typical gastric slow wave recording (freq ~ 0.05 Hz) Slow wave map tracks spread of electrical activity
Noise corrupting the recording Signal of interest Noise (oscillations so fast you can’t see the individual waves) What the electrode records (ruh-roh!)
Graphical Representation of Cosines w Blue = Vin(t) Red = VC(t) Green = VR(t)
Describing a cosine wave with phasors 4.33 2.5 0 5
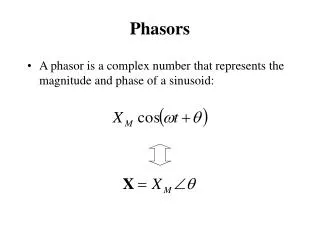
Phasors! -sinwt coswt -coswt sinwt Rotates in time But we just read off the magnitude and phaseinformation
Red vs. blue: What’s different? 1. Magnitude 2. Phase
All shapes and sizes… Typical ones you’ll find in the lab Some big and some small…
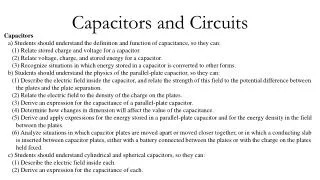
These are capacitors too! Cell membrane Icky cells (bacteria)
And so is this! PC board Red = top layer Green = bottom layer
Implementing a low pass filter (LPF) Strongly attenuated 60Hz Barely attenuated 0.05Hz