Download
1 / 52
520 likes | 812 Vues
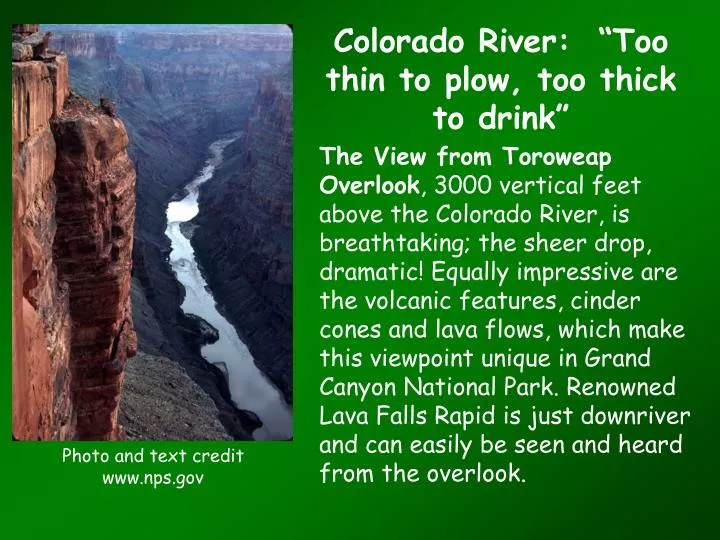
Colorado River: “Too thin to plow, too thick to drink”.

E N D
Colorado River: “Too thin to plow, too thick to drink” The View from Toroweap Overlook, 3000 vertical feet above the Colorado River, is breathtaking; the sheer drop, dramatic! Equally impressive are the volcanic features, cinder cones and lava flows, which make this viewpoint unique in Grand Canyon National Park. Renowned Lava Falls Rapid is just downriver and can easily be seen and heard from the overlook. Photo and text credit www.nps.gov
“Whiskey is for drinking,but water is for fighting about” Quote attributed to Mark Twain, but unverified Water Systems Figure produced by USGS, Geological Fact Sheet 004-99
Map Created by Rob Ribokas, http://www.kaibab.org/misc/gc_coriv.htm
The Colorado River is “born” in the mountains of Utah, Wyoming and Colorado, primarily from melting winter snow pack and seasonal rains. It is approximately 1470 miles in length. Besides water, the system carries about 9 million tons of salt per year and (pre-dams) at least 147 million tons of sediment per year. It is the most heavily “litigated” river in the world
“The Law of the River” A. The 1922 “Colorado River Compact” Flow rates determined at Lee’s Ferry, Arizona based on data from a 3 year average. 18 million acre feet per year. Well…
Wyoming Nevada Utah Colorado California Lee’s Ferry, Arizona New Mexico Arizona http://www.cerc.usgs.gov/data/best/search/colorado.htm
An aerial view of Lee’s Ferry, Arizona http://www.cpluhna.nau.edu/Places/leesferrycrossing.htm
Point 1: Using the Lee’s Ferry flow rates the compact allowed 7.5 maf to the “Upper Basin States” and 7.5 maf to the “Lower Basin States”. Point 2: Any water not “put to good use” by the Upper Basin States could be used by the Lower Basin States Note: The Supreme Court had held earlier that, “First in time, first in right”
Photo by Chris Zarafa- http://www.structurae.net/en/photos/index.cfm?JS=7453 B. The Boulder Canyon Project Act- 1928
Photo by Nicolas Janberg- http://www.structurae.net/en/photos/index.cfm?JS=50 One of the “Seven Wonders of the Industrial World” Built between 1931-1935 at a cost of only $31,000,000 Forms Lake Mead with a capacity of 45,000,000,000 cubic meters of water
Photo credit- http://www.frenchflyer.com/photos/lake_mead/lake_mead-05-tb.html Lake Mead- Aerial photograph
Two-fold purpose of the Dam 1. To control the flow of the river 2. To generate electricity Ancillary results of Hoover Dam 1. Almost eliminated sediment flow down stream from the dam. • Increased salt content by use and • re-use of the water coupled with • evaporation • Completely changed the downstream • ecosystem
OOPSIE- in all of our negotiations between the States, we forgot about Mexico… http://ftp.lib.utexas.edu/maps/americas/mexico.gif
Colorado River Delta http://ftp.lib.utexas.edu/maps/americas/mexico.gif
C. The Treaty of 1945 • Negotiations between the United • States and Mexico began in 1941. • Since 1929 the “Basin States” had • unofficially been allowing Mexico • about 750,000 acre feet per year • and Mexican agriculture in the • delta had flourished. • But by 1941 Mexico was actually • using about 1.5 maf per year 4. But why should “we” give it to them ?
5. There was no provision in the Treaty covering the quality of the water. That would end up “biting the U.S. in the rear” later. But, the Treaty was ratified by both governments and went into effect immediately. More on this later…
D. The Upper Colorado River Basin Compact of 1948. • Which states were considered • “Upper Basin”
Wyoming Nevada Utah Colorado California Lee’s Ferry, Arizona New Mexico Arizona http://www.cerc.usgs.gov/data/best/search/colorado.htm
The Upper Colorado River Basin • Compact of 1948. • Which states were considered • “Upper Basin” 2. The amount of water each state was to receive (remember, the total for the upper basin was 7.5 maf per year) was based on the percentage it contributed to the Colorado River as a whole.
Based on deceit, shenanigans, some data, and political clout the following distribution was hammered out; Colorado would get 52% Utah 23% Wyoming 14% New Mexico 11% and… Arizona 50,000 acre feet
The Colorado River Storage Project • Act of 1956. Authorized the construction of 4 major storage dams Glen Canyon on the main stem Colorado Navajo on the San Juan River in New Mexico Flaming Gorge on the Green River in Utah And 3 minor storage facilities on the Gunnison River in Colorado
The most spectacular of them all is the Glen Canyon Dam 15 miles above Lee’s Ferry and forms Lake Powell. Aerial view of Glen Canyon Dam - photo by Andrew Pernick
http://www.desertusa.com Glen Canyon Dam removes sediment from the Colorado, generates electricity and provides flood control and recreation opportunities
http://www.desertusa.com These dams also hold surplus water from wet years to be used by Upper Basin States in dry years.
Water Systems Figure produced by USGS, Geological Fact Sheet 004-99 Hey! Wait a minute- what about the water quality of Colorado River water delivered to Mexico??? A quick review.
The Problem of dissolved salts • Water at the headwaters of the • Colorado averages about 50 ppm 2. By the time it gets to the Imperial Dam, the last dam on the U.S. side, it averages about 879 ppm. 3. In the early 1960’s the water delivered to Mexico rose above 2,000 ppm. 4. Mexico filed suit in International Court, claiming the water provided to them was killing their crops.
5. The main culprit was water draining back into the Gila River after being used in the Wellton-Mohawk Valley in Arizona, which approached salinity concentrations of >6,000 ppm (nearly double that of sea water- which is about 3,500-3,700 ppm). (not to mention heavy concentrations of fertilizer, pesticides and heavy metals such as Selenium) So, where is the Wellton-Mohawk Valley?
In order to retain the “Water Truce”, the U.S.A. agreed to stop dumping hyper-saline water into the Colorado River drainage via the Gila River. We agreed on an amendment (known as a “Minute” to the Treaty). Minute 242 states that the salinity level entering Mexico can be no more than 115 ppm greater than that of the water exiting the Imperial Dam, which would be about 1,100 ppm.
To accomplish this task, we built a concrete-lined, fifty mile long canal from the Wellton-Mohawk Valley, due south from the Gila River into Mexico. Construction canal was finished (not completed) in 1977. The canal began operation and at peak flows carries about 120,000 acre feet of brackish water
Aerial Photograph of La Cienega de Santa Clara at the end of the Wellton-Mohawk Canal Photograph Dr. Charles Bergman, “Red Delta: fighting for life at the end of the Colorado River
In addition, we spent approximately $350 million to build the Yuma Desalting Plant, designed to clean-up water being returned to the Colorado River. The waste brine would be pumped to the Wellton-Mohawk Canal and dumped in Mexico. After a typical number of delays for a Federal project of that size, the plant went on-line in 1992. The system worked at 1/3 capacity for a few months and then was shut down because of high costs.
At maximum capacity, the plant could produce about 78,000 acre feet per year. At peak production it is estimated that the water produced by the plant would cost area users between $307 and $684 per acre foot in 2004 dollars. One estimate puts the cost at nearly $900 per acre foot.
Currently, Yuma Water District users are billed twice a year at a rate of $15.50 per 5 acre feet.
G. Grand Canyon Protection Act 1992 Photo credit http://sodani.help2go.com/Photos/2003/ 03.24/pages/Grand%20Canyon%20008.htm
Photo credit http://www.explorethecanyon.com/ PicGallery/index.cfm?action=ViewPic&PicID=21 This Act directs the Secretary of Interior to operate the Glen Canyon Dam in a manner that protects the natural resources, cultural resources and visitor uses of the Grand Canyon
The Great California-Arizona War and the “Central Arizona Project” aka CAP Well… you can read all about it at http://www.cap-az.com/
Now, back to the Upper, Lower Basin and Mexico allocations Remember, they were based on 3 years of flow data taken at Lee’s Ferry, AZ. Which yielded an estimate of 18 million acre/feet per year. 7.5 for upper, 7.5 for lower and 1.5 for Mexico. Much of the “excess” was directed for California. The actual average flow rate over the past 500 years has been 13.2 maf.
Now to La Cienega de Santa Clara (remember this was created by waste water shunted to the mud flats of Mexico by way of the Welland-Mohawk Canal) The flow rate varies but usually is about 120,000 acre feet per year of about 3,500 ppm salt. Too salty for agriculture, but just right for plants that thrive in estuarine backwaters
“You Can’t Conserve What is Already Lost” What was once a salt encrusted mudflat is now a verdant marsh land. How did the area go from mudflat to marsh?
Border of La Cienega de Santa Clara with the edge of Sonoran Desert habitat Photograph Dr. Charles Bergman, “Red Delta: fighting for life at the end of the Colorado River
La Cienega de Santa Clara Photograph Dr. Charles Bergman, “Red Delta: fighting for life at the end of the Colorado River
La Cienega de Santa Clara is home to several taxa that receive Federal Protection in the United States under the Endangered Species Act.
Desert Pupfish (Cyprinodonmacularius) Photo: http://wc.pima.edu/Bfiero/tucsonecology/ animals/fish_depu.htm
Yuma Clapper Rail (Rallus longirostris yumanensis)- U.S. Endangered Species Photograph Dr. Charles Bergman, “Red Delta: fighting for life at the end of the Colorado River Estimated that >90% of the World’s population lives totally within La Cienega de Santa Clara, Mexico