Download
1 / 38
380 likes | 598 Vues
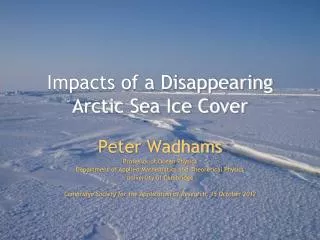
The Arctic sea ice landscape and the movements of narwhals ( Monodon monoceros ). Kristin Laidre (University of Washington), Mads Peter Heide-Jørgensen , Harry Stern, Rune Dietz, Pierre Richard. Greenland. Canada. 2006-2007.

E N D
The Arctic sea ice landscape and the movements of narwhals (Monodonmonoceros) Kristin Laidre (University of Washington), MadsPeter Heide-Jørgensen, Harry Stern, Rune Dietz, Pierre Richard
Greenland Canada
2006-2007 Dietz et al. (2008), Heide-Jørgensen et al. (2003), Laidre et al. (2005)
Extensive southbound fall migration that occurs when annual sea ice forms in the summer grounds. • 2) Over 80% of the world’s narwhals overwinter in Baffin Bay and Davis Strait for 6 months of the year. • 3) High population-level site fidelity to wintering grounds.
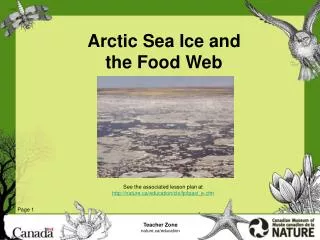
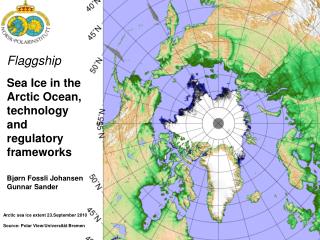
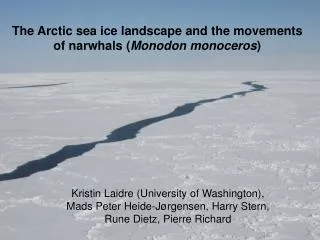
Springtime sea ice off West Greenland (Baffin Bay) Ice is very dynamic, moves >25 km/day
Background wintertime ecology Narwhals make deep dives in winter, >1,800 m 15x per day Narwhals feed almost exclusively on Greenland halibut in Baffin Bay Laidre et al. (2003), Laidre and Heide-Jørgensen (2005)
Winter is a critical feeding period for 6 months of the year Laidre et al. (2004a,b), Laidre and Heide-Jørgensen (2005)
These studies have also demonstrated there are preferred feeding areas on the slope and the more productive east side of Baffin Bay Laidre et al. (2004b)
Questions: 1- Do changes in annual sea ice conditions influence overwintering areas and movements? 2- What is the density and abundance on the wintering grounds? 3- How to quantify sea ice habitat and complexity?
Kakiak Point, Admiralty Inlet, Canada 2003-2005 • N=13 whales tagged in 2003 • N=8 whales tagged in 2004 • N=13 whales tagged in 2005 • Positions until March/April the following year.
Migration Ice data: AMSR-E
Winter kernel home ranges (km2) between 15 November and 15 April
Median Latitude Median Velocity
Narwhals had largest ranges and highest velocities in years with the greatest sea ice cover. • Heavy ice years require whales to conduct compensatory movements to keep up with moving leads and cracks and remain over preferred foraging areas. • Light ice years lead to more stationary behavior over preferred areas for longer periods and lower velocities.
April 2008 survey of narwhal wintering grounds • Double platform visual aerial survey • Long range fuel tank • Twin Otter with bubble windows
Sightings and trackline recorded on a Redhen msDVRs system • Continuous video recording of trackline and digital photography
8 zig-zag transects flown 250 km from shore on a single day Declination angle to sightings measured and converted to perpendicular distance
Two abundance estimates developed: • Conventional distance sampling (CDS) using 44 sightings from the front observers only. • Point conditional mark-recapture (MR) distance sampling allowing for double-platform estimation of 57 sightings (a fully corrected survey specific abundance estimate). 17,239 (CV 0.58) 19,356 (CV 0.45) Both approaches: 9,514 km2 and 405 km of effort
Quantifying sea ice habitat for narwhals: • MODIS satellite images on cloud-free days • High resolution low altitude continuous digital photography on survey track
MODIS sea ice clustering algorithm • Multi-spectral 250 m resolution image classified into four classes of sea ice: • open water • light pack/new ice • medium pack • heavy pack, including ridges and dense snow cover • using the Isodata clustering algorithm (ERDAS Imagine 9.2)
233 km2 of open water in the ~9500 km2 survey area 2.4% of the survey region A density of ~73 narwhals km2 of open water Including the light ice category amounts to an additional 908 km2 of habitat
Digital georegistered aerial photography (2,685 images) Light ice/new ice Old ice Open water
Open water
New ice can be habitat for narwhals Old ice Light ice/new ice
1565 digital images along the trackline (71 sq km). On average, 196 (SD 53) images were taken on each transect. 3.2% (SD 15.9%) open water estimated from in situ images. Laidre and Heide-Jørgensen. 2011. Marine Ecology Progress Series 423:269-278.
Calculated trends in freeze-up timing (date when sea ice concentration rises above some threshold) on the 6 largest narwhal summering areas • Autumn1979-2010 Laidre et al. 2011. Polar Biology
Strongly positive and significant trends (p<0.001) in progressively later dates of freeze-up in all summering areas Freeze-up occurs between 0.5 and 1 day later per year, or 2 to 4 weeks later, over the 31-year time series. Laidre et al. 2011. Polar Biology
Summary • Multi-year fidelity to winter foraging regions in variable environments may confer ecological benefits (i.e., predictable resources, even when energy gain is not consistently high). • ~25% of Baffin Bay population in surveyed area - movements that localize over small areas with very dense sea ice suggest high preference. • Loss of sea ice or changes in freeze up timing, increased anthropogenic impacts (shipping, NWP transit) and seismic exploration all represent threats because the areas are small.
Acknowledgements NASA ROSES Grant# NNX08AF71G Greenland Institute of Natural Resources, Nuuk Department of Fisheries and Oceans, Canada University of Washington Applied Physics Lab, Seattle P. Nicklen