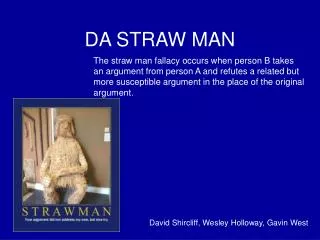
Demand you Da-man
Demand you Da-man. DEMAND-Always refers to the buyer/consumer of a product. Supply and Demand Song. Money Can’t buy me love. Link. Lyrics.


Demand you Da-man
E N D
Presentation Transcript
Demand you Da-man DEMAND-Always refers to the buyer/consumer of a product.
Money Can’t buy me love • Link
Lyrics • Can't buy me love, love Can't buy me love I'll buy you a diamond ring my friend if it makes you feel alright I'll get you anything my friend if it makes you feel alright 'Cause I don't care too much for money, money can't buy me love I'll give you all I got to give if you say you love me too I may not have a lot to give but what I got I'll give to you I don't care too much for money, money can't buy me love Can't buy me love, everybody tells me so Can't buy me love, no no no, no Say you don't need no diamond ring and I'll be satisfied Tell me that you want the kind of thing that money just can't buy I don't care too much for money, money can't buy me love
Does money have any intrinsic value? What are the functions of money? How does demand for money affect its supply? How do you think the supply of money versus the supply of diamonds has changed since the since the Beatles wrote this song? What's the reason for the difference? Although money can’t buy love, money can buy a diamond ring. How does the money supply change today if you pay for the diamond ring with credit as opposed to a debit card?
Supply and Demand • Song
My boss he's a probable bore.Put me hands and knees on scrubable floor.Do it right receive the lions share bliss.Know all too well just where that ration is.Learned a lot about the company doe.Learned less about receiving it though.Saw how it came to those who always sat pretty.Don't need it.Supply and demand.My girl had a probable cause or so she said and took a probable pause.I was dumped for occupying her time.I asked her why and what was next in line.She said "Shiny hair that's my life ambitionbut I'll devote my time to a new omission the rizzle-razzle kitsch of paranoid city".Don't need it.Supply and demand.Supply and demand.
Draw a supply and demand diagram that shows the boss receiving “the lions share bliss” while someone who scrubs floors gets much less. In other words, what factors would affect supply and demand such that CEO’s receive 300 times the compensation of average workers? Are CEO’s paid too much?
Price D1 Quantity Demand Curve always looks like this. You can look at it as going down. What do you notice about the relationship between price and quantity?
THE LAW OF DEMAND (Memorize this) AS PRICES GO UP PEOPLES DEMAND FOR PRODUCT GOES DOWN AS PRICES GO DOWN PEOPLES DEMAND FOR PRODUCT GOES UP.
The Demand Curve: The Relationship between Price and Quantity Demanded • Demand Schedule • The demand schedule is a table that shows the relationship between the price of the good and the quantity demanded.
DEMAND SCHEDULE Price Quantity 10 9 8 7 6 1 2 3 4 5
The Demand Curve: The Relationship between Price and Quantity Demanded • Demand Curve • The demand curve is a graph of the relationship between the price of a good and the quantity demanded.
1. A decrease in price ... 2. ... increases quantity of cones demanded. Figure 1 Catherine’s Demand Schedule and Demand Curve Price of Ice-Cream Cone $3.00 2.50 2.00 1.50 1.00 0.50 Quantity of 0 1 2 3 4 5 6 7 8 9 10 11 12 Ice-Cream Cones
Shifts in the Demand Curve • Change in Quantity Demanded • Movement along the demand curve. • Caused by a change in the price of the product.
B $2.00 4 Changes in Quantity Demanded A tax on sellers of ice-cream cones raises the price of ice-cream cones and results in a movement along the demand curve. Price of Ice-Cream Cones A 1.00 D 0 8 Quantity of Ice-Cream Cones
A PRICE CHANGE ALSO KNOWN AS A MOVEMENT ON THE CURVE OR LIKE DAY LIKES TO SAY A DOT TO DOT Price QD Notice the price is going down so what happens to the quantity demanded 5 4 D1 10 20 Quantity
Price QD D1 Price can also go up. What happens to Quantity Demanded? Notice the price is going up so what happens to the quantity demanded 5 4 7 25 Quantity
Price QD D1 Quantity DOT TO DOTS • PRICE CHANGES ARE ALWAYS MOVEMENTS ON THE CURVE. • EXAMPLE SOMETHING GOES ON SALE!!!! • ARROW GOES UP OR DOWN BASED ON WHAT THE PRICE IS DOING!!!!!
Price QD D1 Quantity Important Note- This is what the graph looks like only if the PRICE of the product has changed!!!!!!!!!!!!!!!!!!!!!!!!!!!!!!!!!!!!!!!! Price QD D1 Quantity PRICE CHANGE!!!!!!!!!!!!!!!!!!!!!!
So you have learned what a price change looks like now lets look at something else. • Shifts in Demand!!!!!!!!!!!!!!!!!! These are when people want to buy or not buy a product for any other reason besides the price changing!!!!!!!!!!!!! ANY OTHER REASON
D Price Price QD d2 d1 Quantity D1 Quantity Price Change Change in Demand Price QD D1 Quantity D Price d1 d2 Quantity
QD Vs Change in D • To help reveal the difference, I draw a graph relating the time that a student spends preparing for an exam to his expected grade. It shows that, generally speaking, as a student studies more, he makes a better grade, i.e., one moves along the curve. Now, I ask the students what would happen if they somehow came into possession of a copy of the exam. They respond, naturally, that they would probably be able to make a higher grade than before given the same amount of study time. In other words, the function shifts.
Shifts in the Demand Curve • Change in Demand • A shift in the demand curve, either to the left or right. • Caused by any change that alters the quantity demanded at every price.
This product more people want to buy but not because the price went down. Look at the price and Quantities Notice the price stayed the same D Price 5 d2 d1 6 10 Quantity
D Price d2 d1 Quantity When the curve shifts it is called a Change in Demand. • There are certain things that will make the demand curve shift. These are called the determinants of demand. D Price d1 d2 Quantity
Shifts in the Demand Curve • Consumer income • Prices of related goods/complimentary and substitute goods. • Tastes • Expectations • Number of buyers
Expectations • College students are often a poor down‑trodden lot who must pinch pennies to get by and often subsist for most of their college careers on oatmeal or macaroni and cheese. They have to walk around in old rags. (Playing up the poverty of students gets sympathetic attention!) They endure this extreme deprivation until the last semester of their senior year. Then they start to apply for jobs and go to interviews. You can easily tell who is doing well in the job search process, they are the students who go out for pizza and beer and who begin to sport flashy new clothes! You can also distinguish between majors, accounting and computer science majors with high expectations will go out for pizza frequently, philosophy majors perhaps once or twice! Why does this occur? It is because good interviews give students confidence that in a few months their era of poverty will draw to a close. It is not necessary to even receive their first paycheck for these students to begin to alter their consumption patterns. Most have some slight reserve of cash, and the mere expectation of fat checks in a few months is enough to loose the bands on their coffers. Those without any nest egg may be inclined to borrow a bit, knowing that repayment will be easy. Budding accountants and systems analysts can, of course, be more prodigal since the size of the paycheck they anticipate is substantially fatter than that expected by the average philosophy major. Expectations of the future are a broad and powerful demand shifter not limited to expectations of future prices of a specific good.
6 shifts-Determinants of Demand you must memorize this!!! • CT=CONSUMER TASTE- What people THINK • CI-CONSUMER INCOME- How much money people have • SUBSTITUTE GOOD-SG- Good that is bought instead of another good-example COKE AND PEPSI • COMPLIMENTARY GOOD-CG- Goods that are bought together like PB AND JELLY • # BUYERS-#B-The number of potential customers. More people = more demand and vice versa • EXPECTATIONS-E-Anticipation of something happening.
Increase in demand Decrease in demand Demand curve, D 2 Demand curve, D 1 Demand curve, D 3 Figure 3 Shifts in the Demand Curve Price of Ice-Cream Cone Quantity of 0 Ice-Cream Cones
Market Demand versus Individual Demand • Market demand refers to the sum of all individual demands for a particular good or service. • Graphically, individual demand curves are summed horizontally to obtain the market demand curve.
The Market Demand Curve The market demand at $2.00 will be 7 ice-cream cones. When the price is $2.00, Nicholas will demand 3 ice-cream cones. When the price is $2.00, Catherine will demand 4 ice-cream cones. The market demand curve is the horizontal sum of the individual demand curves! + = Nicholas’s Demand Catherine’s Demand Market Demand Price of Ice-Cream Cone Price of Ice-Cream Cone Price of Ice-Cream Cone 2.00 2.00 2.00 1.00 1.00 1.00 13 7 3 5 4 8 Quantity of Ice-Cream Cones Quantity of Ice-Cream Cones Quantity of Ice-Cream Cones When the price is $1.00, Catherine will demand 8 ice-cream cones. The market demand at $1.00, will be 13 ice-cream cones. When the price is $1.00, Nicholas will demand 5 ice-cream cones.
Shifts in the Demand Curve • Consumer Income • As income increases the demand for a normal good will increase. • As income increases the demand for an inferior good will decrease.
Consumer Income Normal Good Price of Ice-Cream Cone $3.00 An increase in income... 2.50 Increase in demand 2.00 1.50 1.00 0.50 D2 D1 Quantity of Ice-Cream Cones 0 1 2 3 4 5 6 7 8 9 10 11 12
Consumer Income Inferior Good Price of Ice-Cream Cone $3.00 2.50 An increase in income... 2.00 Decrease in demand 1.50 1.00 0.50 D2 D1 Quantity of Ice-Cream Cones 0 1 2 3 4 5 6 7 8 9 10 11 12
Shifts in the Demand Curve • Prices of Related Goods • When a fall in the price of one good reduces the demand for another good, the two goods are called substitutes. • When a fall in the price of one good increases the demand for another good, the two goods are called complements.
EXAMPLES-get a board and marker • COKE GOES OFF SALE!!!! • COKE-STOCK MARKET CRASHES!!!! CAUSING A GREAT DEPRESSION!!! • COKE- PEPSI GOES OFF SALE • COKE-CHIPS GO ON SALE • COKE-CHINA GOES BANKRUPT AND ALL THE PEOPLE IMMIGRATE TO THE UNITED STATES!!!!!!!! • COKE-EXPECT THE PRICE OF COKE TO GO DOWN!!!!!!!!!!!!!!!!!!!!!!!!!!!!!!!!!!!!!!!!!! • COKE-GOES ON SALE GRAPH COKE AND PEPSI DON’T
Price D1 Quantity Graph Coke is bad for you. D d2
PEPSI GOES ON SALE GRAPH COKE AND PEPSI P P QD D D1 D2 COKE Q Q PEPSI
CHIPS RAISE THEIR PRICE GRAPH COKE AND CHIPS D1 D2 CHIPS COKE
COKE CAUSES CANCER P D D1 D2 Q
examples • Coke goes off sale • Coke- and pepsi go on sale graph both • Coke-Lebron James advertises for coke graph coke and Pepsi • Coke- Govt cuts consumer taxes
Lets Move on to SUPPLY • Supply is always looked at from the manufacturer/seller/producer of a product.
The curve looks like it goes up!Thus sUPply Price Quantity
SUPPLY • Quantity suppliedis the amount of a good that sellers are willing and able to sell. • Law of Supply • The law of supply states that, other things equal, the quantity supplied of a good rises when the price of the good rises.
The Supply Curve: The Relationship between Price and Quantity Supplied • Supply Schedule • The supply schedule is a table that shows the relationship between the price of the good and the quantity supplied.