Download
1 / 49
550 likes | 625 Vues
Explore the significant signals and data from the Last Glacial Maximum (LGM) 21,000 years ago, including climate, ice sheet reconstructions, vegetation changes, and sea level variations. Understand the implications for future climate projections and the evidence for global cooling. Discover how model-data comparisons help in studying LGM climate dynamics.

E N D
Lecture 14: The LGM (Last Glacial Maximum) Part III: Deglacial and Millennial Climate Changes (Chapter 12)
Last Glacial Maximum Big signal 21,000 Much more data, with 14C dating
Mammals of the Last Glacial Maximum (21,000 years ago)
Climate forcing since LGM CO2 sensitivity Obital similar Ice Sheet (NH)
CLIMAP: Reconstruction of LGM Climate Colder ! LGM August SST LGM- present August SST
LGM SST Changes, Data uncertainty CLIMAP 81: El Nino-like Prell 85: La Nina-like Broccoli, A., 2000
How large is the Ice Sheet at LGM? More Ice! Why the greatest ice sheet not over Siberia?
LGM reconstruction of North America Ice Sheet East-west asymmetry, why?
Sea Level Change LGM IPCC/AR4 2007
Ice sheet contribution to sea level Which value should be used for isotope balance?
LGM desert and sand (expanded) Sand dunes today Sand dunes LGM
LGM desert and dust Drier and windier! 10 times more dust LGM desert dust LGM loess deposits
Projected Precipitation Changes (%) in response to Future CO2 (AR4) Rich get richer and poor get poorer!
Climate forcing at LGM CO2 sensitivity Obital similar Ice Sheet (NH)
Implication to future projectioin? Sand dunes today LGM
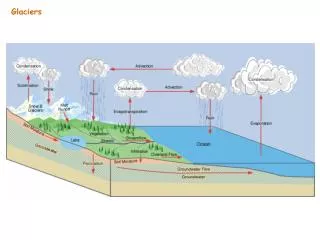
Ice Age climate deposits Winds lift and transport dust downstream and around the world Colder/drier loss of vegetation cover, stronger wind. weight grinding Freezing-thaw Water/rain rework Ice sheet moraines boulder, cobble sand loess (silt-size) dust (clay-size)
LGM ice rafting Freshwater melting..
How to compare model climate with data (vegetation)? Biome models Now: Interactive climate-ecosystem model
Vegetation and Climate Pollen distributions and climate Wetness indicator Cold spiece Warm spiece
Pollen history in a lake core Wetness minimum in mid-Holocene? Decrease cooling Iincreasing warming
Modern/LGM spruce pollen Data/model LGM spruce pollen
Simulated LGM Climate Alaska, warmer Cold, drier Split of jet, snow storm, cold, wetter
Model/data mismatch Too much warm-adapted trees, Cooler Mississippi outflow at LGM may help the cooling in the observation.
Vegetation in Europe Modern LGM Cold and dry, out flow from Scandinavia ice sheet and North Atlantic
LGM northern Asia Colder and drier Stronger Aleutian High, stronger winter monsoon flow, reduced moisture source from N. Atlantic Closing of Bering Strait….
LGM climate in the Southern Hemisphere Why global synchronous cooling? CO2 LGM sea ice expansion around Antarctic
LGM tropical cooling: Important for Testing Climate Sensitivity Evidence for small cooling: Ocean, 1-2oC Not much difference of plankton assemblages (Pacific and Indian Oceans) Similar estimates: Alkenone method and CLIMAP modern analogue
The problem of tropical cooling: mismatch between SST and mountain snowline Evidence of large cooling: Land, DT > 4 - 6 C Mountain snowline
1910 Recession of the Grinnell Glacier “Glacier National Park” 1997 Source: D. Fagre, USGS, 2004
Tibetan Plateau: Trends in surface air temperature with elevation: 1961-90 3rd polar amplification? Source: Liu and Chen, 2000
Biosphere “hotspots” identified by Conservation International Much of the American Cordillera has high biodiversity but is under threat from climate change and land use pressures
Projected change in annual mean temperature with 2x CO2 C Source:Bradley et al., 2004: GRL
Clues to Tropical cooling discrepancy? • High altitude more sensitive to climate change (lapse rate change) • Plant physiology effect (trees are less efficient in photosynthesis under a lower CO2 environment)
Response of North Atlantic thermohaline present LGM
LGM model-data comparison: SST 21 ka – 0ka
AMOC model-data comparison Proxy CCSM3 Salinity AMOC Δ 13C 0ka 21ka
AMOC model-model comparison?? Observation AMOC in Models (PMIP2) Δ 13C CCSM HadCM MIROC ECBILT_CLIO 0ka 21ka Otto-Bliesner et al., 2007, GRL
Future Projection of AMOC in IPCC IPCC, 2001, TAR IPCC, 2007, AR4 Is it consistent with LGM evidence?
LGM Wind, or Buoyance? SO brine injection AABW Obs: Δ13C CCSM: Salinity AMOC Ideal Age Holocene ~1000 yrs LGM 21ka ~500 yrs Other PMIP2s failed
Reference for reading • Shin S., Z. Liu, B. Otto-Bliesner, E. Brady, J. Kutzbach, 2002: Southern Ocean sea-ice control of the glacial North Atlantic thermohaline circulation. Geophys. Res. Lett., 30, DOI:10.1029/2002GL015513 • Liu, Z., S. Shin, R. Webb, W. Lewis and B. Otto-Bliesner, 2005: Atmospheric CO2 forcing on glacial thermohaline and climate. Geophys. Re. Lett, 32, L02706, doi:10.1029/2004GL021929