Diversification: why and how?
Diversification: why and how?. Ricardo Hausmann Harvard Kennedy School & Center for International Development at Harvard University. A reinterpretation of the sources of growth. Why are some countries rich and others poor?. The traditional explanation.

Diversification: why and how?
E N D
Presentation Transcript
Diversification: why and how? Ricardo Hausmann Harvard Kennedy School & Center for International Development at Harvard University
Why are some countries rich and others poor? The traditional explanation
Why are some countries poor and others rich? • The traditional answer emphasizes factor accumulation and “aggregate” productivity • Countries are rich because they work with more: • Physical Capital (accumulated through investment) • Human Capital (years of schooling) • …and have more “total factor productivity” • …which lets them get more output per capita • Policy implications: • More education and health • More savings to finance investment (and micro-finance) • More property rights to assure investors • More “productivity”
The neo-classical dead-end • Assume the world is made out of four things • Output • Physical capital • Human capital • Labor • 85% of growth is explained by non-of-the-above • Total Factor Productivity = a measure of our ignorance (Abramovits, 1958) • Maybe it is not that good a way to parse what the world is made out of
Rich countries do not just produce more per capita They produce different products
An alternative view • Countries differ in the variety of the capabilities they have • Rich countries make more kinds of products and more complex products that require many capabilities • Poor countries make simple products that reflect the few capabilities they have
The hidden structure in the comparative advantage of nations
The hidden structure in the comparative advantage of nations
Countries Products
Countries Capabilities Products
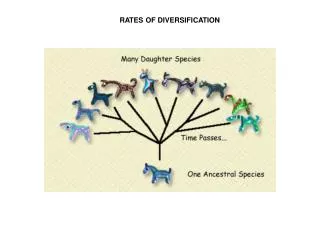
Intuition • Countries have capabilities • Products require capabilities • Countries that have more capabilities will be able to make more products • They would be more diversified • Products that require more capabilities will be made by fewer countries • Products will be less ubiquitous
Intuition (cont’d) • Countries that have more capabilities will be able to make products that are less ubiquitous • Hence, countries that have more capabilities will be more diversified but will make less ubiquitous products • Diversification of countries and ubiquity of products are negatively correlated • They are indirect measures of the capability set of countries
Method of Reflections: k-k1 diagram Average ubiquity of products Hidalgo CA, Hausmann R Proc. Natl. Acad Sci. (2009) 106(26):10570-10575
Diversification correlates with income per capita Log GDP per capita Diversification
Hidalgo CA, Hausmann R Proc. Natl. Acad Sci. (2009) 106(26):10570-10575
Complexity in 1985, controlling for initial GDP per capita Hidalgo CA, Hausmann R Proc. Natl. Acad Sci. (2009) 106(26):10570-10575
What makes growth difficult? • The chicken and egg problem • You cannot make new products because you lack the capabilities • You don’t want to accumulate the capabilities because the products that need them are not being made • Because of other missing capabilities • How does the world deal with this? • By moving towards “nearby” products
Step 1: Maximum Spanning Tree Our Approach: • Distance measured by probability that, if a country is good in one product, it’s also good in another product. • What is the shape of a forest? • Homogenous or Heterogeneous? • What does it look like?
Step 2: Overlay Strong Links 0.4 > 0.4 – 0.55 0.55 – 0.65 0.65 <
Using Feenstra et al. Trade Data: 132 Countries 1006 Products SITC-4(1975-2000) CA Hidalgo, B Klinger, A-L Barabasi, R Hausmann.Science (2007)
Key Implications • Monkeys jump short distances • So, where you are now in the product space determines where you can jump • In the case of Malaysia, they moved to and dominated the electronics cluster • How are the ECA countries placed in this space?
Poland (2000): very well connected & diversified (although no presence in electronics)
Russia (2000): Highly peripheral, concentrated in hydrocarbons and raw materials
The Ukraine (2000): somewhere in between- more connected than Russia, not as well connected as Poland
Summarizing this ‘connectedness’ with one number: Open Forest Open forest: option value of jumping to other trees Income per capita
Countries in Eastern Europe and Central Asia face very different opportunities Open forest: option value of jumping to other trees Income per capita
Countries with a better-connected export basket did not suffer as deep an output collapse during transition Open forest in 1992 Depth of Transition Recession (% of 1990 GDP per capita reached at trough)
..and tend to be those closer to the west. Open forest in 1992 Distance to Dusseldorf But proximity to the West has no effect on transition beyond its impact on the export mix: open forest trumps distance to Dusseldorf in a cross-country regression
Some implications • Why do many poor countries not catch up to rich countries? • Because there is no “stairway to heaven” or sequence of nearby trees that can get them to the denser parts of the product space • What causes the “resource curse” (bad performance by resource rich countries)? • Poor connectedness of the resource intensive sectors • Add value to your raw materials? • Forward supply linkages vs capabilities • Finland • Why do countries fall into protracted slumps? • Because their existing export products get into trouble when they are in a part of the forest where there are no nearby trees • Is innovation the solution? • It is about finding profitable excuses to accumulate capabilities that will be used for some other purpose down the road
Strategic approaches Let it be It ain’t broke Ample space to move in all directions Stairway to heaven Parsimonious industrial policy Help jump short distances to other products High Ease to jump to new products: open forest Hey Jude: make it better Competitiveness policy Improve the quality of what already exists Bridge over troubled waters Strategic bets Little space to improve quality and few nearby trees Low Low High Space to grow in existing products
Countries face different opportunities to jump to other trees
Countries with closer nearby trees grow faster Average growth 1985-2005 Open Forest 1985