Oakland Unified School District
560 likes | 833 Vues
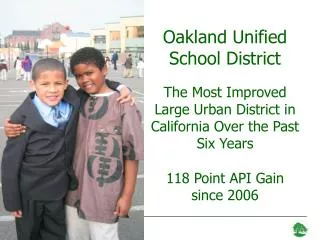
Oakland Unified School District The Most Improved Large Urban District in California Over the Past Six Years 118 Point API Gain since 2006. Oakland USD Data (2009). Students District enrollment (includes 1,827 Pre-K) 41,082 Adult Education Programs 25,138 Number of Schools 104

Oakland Unified School District
E N D
Presentation Transcript
Oakland Unified School District The Most Improved Large Urban District in California Over the Past Six Years 118 Point API Gain since 2006
Oakland USD Data (2009) • Students • District enrollment (includes 1,827 Pre-K) 41,082 • Adult Education Programs 25,138 • Number of Schools 104 • English Learners 23.1% • Free or reduced lunch 70.18% • Attendance rate 94.5% • Student Ethnic and Racial Distribution • African American 35.3% • Hispanic or Latino 34.7% • Asian 14.6% • White (not Hispanic) 7.0% • Multiple or No Response 6.2% • Pacific Islander 1.1% • Filipino 0.8% • American Indian or Alaska Native 0.4% • Oakland Charter Schools (1993-2010) • 42 Petitions approved, 32 Operating, 5 Revoked, 3 Surrendered • District authorized charter school enrollment 7,621
VISION:All students will graduate as caring, competent and critical thinkers, fully informed, engaged and contributing citizens, prepared to succeed in college and career. — GOALS — Students take responsibility forthemselves and the common good. Students will possess personalmotivation, skills and resiliencynecessary for success in life and the workplace. All students will meet or exceed rigorous standards in all academic disciplines. All students will: Graduateprepared to succeed in college and the workplace. Succeed in Algebraby the end of ninth grade. Read and writeby the end of third grade. — BOARD PRIORITIES — Effective Instruction for Every Student, Every Classroom, Every Day Safe and Supportive Schools Literacy for College and Career Readiness ACHIEVEMENT • EQUITY • ACCOUNTABILITY Core Values Underlying Our Work
District Goals and Strategic Priorities 12th Grade: Ready for College and Career 9th Grade: Proficient in Algebra 3rd Grade: Proficient in Reading and Writing Effective Instruction Every Day Safe and Supportive Schools Success in College and Career
The Results So Far… Five Year Data: • 118 point district API growth past five years, highest by far of any large urban in CA • 14 point increase in graduation rate, narrowed gap w African American and Latino students • 30+ point gain in CST in Elementary math and ELA proficiency • Significant gains by schools and central office depts. on satisfaction surveys New Data: • All subgroups growing, Latinos narrowing achievement gap • District math CST grade 4 at 65%, grade 5 at 61% proficient/adv., beating the state average • Strong growth in 9th grade, extending grade spans with growth • Almost 50% of schools with 25+ pt. API gain
OUSD Demonstrates Largest 6 Year API Gains 118 API points
Quality Options Empowered School Leaders Personalized Learning Expect Success Performance Management Standards Based Instruction Technology Paper to computer Manual to automated Sustainable systems Smart use of data Expect Success Reform: 2003-10 Dollars follow students More equitable funding More flexibility in spending Families make choices District manages school portfolio Small class sizes & schools Small learning communities Small principal networks Investment in people Service Standards Transparent scorecards Public results Standards-Based Pacing & Assessments Collaborative Teacher Inquiry (PLC) Targeting Curriculum & PD
Quality Options Empowered School Leaders Personalized Learning Expect Success Performance Management Standards Based Instruction Technology Paper to computer Manual to automated Sustainable systems Smart use of data Expect Success Reform: 2003-10 Dollars follow students More equitable funding More flexibility in spending Families make choices District manages school portfolio Small class sizes & schools Small learning communities Small principal networks Investment in people Service Standards Transparent scorecards Public results Standards-Based Pacing & Assessments Collaborative Teacher Inquiry (PLC) Targeting Curriculum & PD
Vision, Values, Goals Strategy & Strategic Projects Created a Culture of Accountability and Support at Each Level Board of Education Coherent Governance Cabinet Strategic Planning Cycle Schools & Central Office School Goals/Scorecards Service Area Goals/Scorecards • Homerun Projects • Contracting • Safety • Pay Concerns • On-boarding • Substitute Fill Rate • Clean Schools SPSA, RBI & Team Awards SIPs, CPI & Team Awards Employee Evaluations, Individual Learning Plans & Individual Awards Individuals Individual Goals
Performance Accountability: Created a Data-Driven, Results-Oriented Culture Customer Service Culture Leadership Professional Development Rewards &Consequences Data Collection & Reporting Evaluation Inquiry & Accountability Cycle
Results-Based Cycles of Inquiry Schools have the flexibility to partner with a professional development provider or data coach of their choice. Principals provide evidence of their inquiry work to Network Executive Officers. • Central Office Supports Results-Based Inquiry in the following ways: • Every administrator, teacher and coach has online access to real time student level data. Additional reports are released regularly. • Standards-based common assessments are administered four times per year in Math and English Language Arts, and teachers have access to a robust item bank to create their own assessments. • Principals receive data training and support from their Network Executive Officer, central office coaches, and peers at network meetings two times per month.
Annual Scorecards Ensure Public Accountability • Every school posts a scorecard outside of the main office. Scorecards include information regarding: • Enrollment, • Summary performance data • Student achievement and school climate and culture data, • Qualitative description of the school.
Quality Options Empowered School Leaders Personalized Learning Expect Success Performance Accountability Standards Based Instruction Technology Paper to computer Manual to automated Sustainable systems Smart use of data Expect Success Reform: 2003-10 Dollars follow students More equitable funding More flexibility in spending Families make choices District manages school portfolio Small class sizes & schools Small learning communities Small principal networks Investment in people Service Standards Transparent scorecards Public results Standards-Based Pacing & Assessments Collaborative Teacher Inquiry (PLC) Targeting Curriculum & PD
School Portfolio Management Framework School Portfolio Management: Managing the Success and Quality of SchoolsThe District will provide a diverse portfolio of high quality schools for students and families both within neighborhoods and district-wide Quality OUSD is continually managing its dynamic portfolio of schools across these three dimensions Enrollment / Capacity Programmatic Diversity High quality and diverse educational options SUPPLY DEMAND
Tiered School Accountability and Support In order to accelerate achievement in every school, OUSD differentiates the supports and interventions provided based on where schools currently exist along the continuum from needing intervention to having demonstrated a capacity to accelerate achievement. This differentiation also allows for innovation while increasing accountability across the system Tiering Criteria: i) Absolute Performanceii) Accelerated Student Level Growth iii) Closing the Achievement Gap BLUE Tier GREEN Tier YELLOW Tier ORANGE Tier RED Tier Increased Monitoring and Support Increased Curricular Flexibilities awarded through application process Accountability for Results
Quality Options Empowered School Leaders Personalized Learning Expect Success Performance Accountability Standards Based Instruction Technology Paper to computer Manual to automated Sustainable systems Smart use of data Expect Success Reform: 2003-10 Dollars follow students More equitable funding More flexibility in spending Families make choices District manages school portfolio Small class sizes & schools Small learning communities Small principal networks Investment in people Service Standards Transparent scorecards Public results Standards-Based Pacing & Assessments Collaborative Teacher Inquiry (PLC) Targeting Curriculum & PD
Common Vision and Aligned System Requires Effective Practice Defined at Each Level Achievement Equity Accountability Effective Learner Effective Instruction Effective Leadership Effective Schools Effective District Office Vision & Core Values 22
To Implement the District Priorities, we must have Effective Leadership Our Theory of Action for Principal Leadership is… If we recruit, develop, support, and retain strong, learning-focused principals at each school, hold them accountable for achieving ambitious goals, and allow guided budget authority and opportunities for curricular flexibility to meet the goals, those principals will develop highly effective teachers, empower their communities, and create a vibrant, collaborative culture so that all students achieve at high levels.
Regional Team Network Officers OUSD Network Model Effective Instruction Every Day School Leadership Team Recruits, develops, supports, challenges, holds accountable High Levels of Student Learning Safe and Supportive Schools Strong Learning- Focused Principals Aligns Support Supports Recruits, develops, supports, challenges, holds accountable Central Service Departments Literacy for College and Career Success Supt. & Cabinet • Defines goals and targets • Defines district-wide strategies • Brokers relationships (internal and external) • Supports, challenges, inspires, holds accountable Board
Developing and Supporting Principal Leadership • Pipeline partnerships to find and select the best possible site administrators • Coaching for new administrators • Network Officers intensively support and supervise principals, monitor school progress toward goals • Small networks and inquiry groups allow principals to share effective practices and create a learning focused culture • Results-Based Budgeting gives principals real cost control over resources • School Quality Practices set the standard and path for school improvement
Effective School Practices & Supports • Effective School Practices • School-wide focus on effective instruction and assessing student learning • Grade level standards based curriculum, aligned assessments, and effective instructional strategies for all students • Data-based collaborative inquiry on individual student progress • Aligned resources and structures to support effective and student learning • Safe, positive school climate and culture • Partnerships with parents and the community Supports & Resources • Curriculum & Pacing Guides • Assessments • Tools and Coaching for Collaborative Inquiry • Professional Development in Core Curriculum, Interventions and Instructional Strategies (Swun Math; OCR; Writing; ELD) • Principal Learning and Leadership Coaching • Operations Support • Extended Learning • Linked Learning & “a-g”
Quality Options Empowered School Leaders Personalized Learning Expect Success Performance Accountability Standards Based Instruction Technology Paper to computer Manual to automated Sustainable systems Smart use of data Expect Success Reform: 2003-10 Dollars follow students More equitable funding More flexibility in spending Families make choices District manages school portfolio Small class sizes & schools Small learning communities Small principal networks Investment in people Service Standards Transparent scorecards Public results Standards-Based Pacing & Assessments Collaborative Teacher Inquiry (PLC) Targeting Curriculum & PD
#2 Cox1240 Students #1 Webster990 Students #3 Fruitvale730 Students #2 Bella Vista750 Students #2 Allendale590 Students #3 Franklin860 Students #3 Manzanita921 Students #1 Highland830 Students #1 Whittier682 Students #2 Horace Mann540 Students #1 Hawthorne1447 Students #2 Stonehurst800 Students #8 Lincoln640 Students #2Lockwood876 Students #1 Woodland265 Students Hills: #7 Kaiser274 Students #10 Thornhill350 Students #7 Grass Valley240 Students #7 Munck315 Students #10 Hillcrest260 Students #10 Joaquin Miller356 Students #10 Redwood Heights280 Students #9 Chabot370 Students #10 Montclair350 Students School Size Matters: Is This Fair? Color Key:# API Ranking: 10 is the highestEnrollment Flatlands: Lake Merritt #1Jefferson1009 Students #2 Garfield950 Students #2Melrose490 Students
New Small Schools Theory of Action • Effective leaders guide effective teams of leaders who have control over the variables for success in an accountable system will create success. • Schools that are filled with at-risk student populations need to be small so they can develop strong adult relationships, personalized learning, and safety nets. • Teachers working with such populations need strong intimate learning communities to be effective
OUSD New Small School Incubation • New schools emerge from an identified community need • Incubator converts small declining enrollment, failing schools into new up-and-coming school that attract enrollment, through community-based design team process. • Incubator converts large, over-utilized failing school into new optimally sized up-and-coming school, through community-based design team process. Process New optimally-sized up- and-coming school INCUBATOR Design Team Small, underutilized, declining enrollment, failing schools New optimally-sized up- and-coming school New optimally-sized up- and-coming school INCUBATOR Design Team New optimally-sized up- and-coming school Large, over-utilized failing school
Who is on the Design Team? Example: Design Team Design Team Team of 10 Parents, Community Members, Students, and Educators Design Community Large group of parents, community members, students, and educators School Community School staff, administration, students, and families. Community organizations and neighborhoods. Oakland Unified School District and New School Development Group • Liz O., Design Team leader • Marley C., parent • Elisa E., parent • Myesha L., parent • Jesus R., community partner (OCO) • Gilbert Z., community partner (Evenstart) • Eduardo E., teacher • Tim H., teacher • Linda T., teacher
49 New Small Schools in Oakland: 2000 - 2008 Fall 2004 Fall 2003 Fall 2000 Fall 2005 Fall 2006 Fall 2001 Fall 2007 Fall 2008 Fall 2002 *MetWest *KIPP Bridges Academy Coliseum College Prep Maxwell Park Int’l Academy West Oakland MS Encompass Academy New Highland ACORN Woodland *School of Social Justice & Community Development Sankofa Academy Roots Int’l **Explore Leadership Prep Learning Without Limits Alliance Academy Futures Elementary Think College Now *BEST HS EXCEL HS ASCEND Elmhurst Community Prep East Oakland School of the Arts *East Oakland Community HS *Community United Elementary Esperanza Elementary Global Family School Media College Prep Urban Promise Int’l Community School Reach Academy YES Manzanita SEED *Peralta Creek United for Success Academy *Kizmet Academy CBITS Mandela HS Melrose Leadership Academy RISE East Oakland PRIDE College Prep & Architecture Greenleaf Elementary Life Academy PLACE @ Prescott *Robeson School of Visual & Performing Arts *Closed (7) *Opened befpre incubation (2) *National model, no OUSD incubation (3) Manzanita Community School Fred T. Korematsu Discovery Academy *International HS Graphic: Courtesy of Jean Wing, OUSD New School Development Group - 32 -
OUSD INCUBATION PROCESS: 2004-09 New School Incubator Curriculum – 1st Semester Graphic: Courtesy of OUSD New School Development Group
Community Analysis Theory of Action Vision OUSD INCUBATION PROCESS: 2004-09 New School Incubator Curriculum – 2nd Semester May - Jun Graphic: Courtesy of OUSD New School Development Group Mar - Apr Jan - Feb Instructional Program Instructional Program SCHOOL DESIGN PROPOSAL = THE FOUNDATION
Conditions That Have Promoted New School Success in OUSD Leader • Desires to start a new school and willing to embrace the challenge • Has successful experience as an administrator, and as a leader in OUSD • Has experience in the specific school community in which s/he is started a school Community • Wants a new school • Participates in the leadership selection and on the design team Staff • Selected because their vision aligns with the school vision • Chooses to be part of the new school • Participates in the design (majority)
Conditions That Have Promoted New School Success in OUSD Planning & Design (Incubation) • Happens before school opens • Led by the person who becomes the principal • Comprehensive one-year process • Coaching provided to design team • Clear theory of action and aligned program Opening • Identified permanent facilities • Received coaching in year 1 to support implementation of design • Received operations support in year 1 to allow leadership to move past operations to instruction and culture • Limited starting grade span, expanding annually
Stanford Study of OUSD New Small Schools Initiative Research Goals: To understand how well new small schools and existing schools in OUSD are performing over time, taking into account the students they serve and their process of start-up & development To understand what factors influence schools’ achievement and their improvement trajectories over time To recommend policy strategies that can build on current successes and address identified needs and issues
Key Measure in the Study – School Level “Productivity” Productivity is a school’s capacity to add value to students’ learning beyond students’ prior achievement and background characteristics. Productivity is evaluated by looking at how a school’s students achieve on the CST tests in comparison to those in schools serving similar students. A productive school produces achievement that is significantly higher than this benchmark.
Student Level Factors Explain about 2/3 of Variance in CST Scores School and Other Factors 30.4% *CST Math model explained 66% of variance, leaving 34% to be explained by school and other factors
School Design Features Influence Productivity School Level CST Scores (Standard Scores)
API and Three-Year Average Productivity: Elementary ELA Mean “Old” Schools = -.012 Mean New Schools = .019 Acorn Woodland API 2008 Three-Year Average Productivity
Learnings from New Small School Work • Move out resistant staff from the outset. Staff forced to participate perpetuate toxic culture • Design team needs dedicated time and support to be successful. • Design teams need a strong theory of action to ground their plans, otherwise it becomes hard to know what to prioritize • New schools need a lot of help implementing their plans. Year 1 is often focused on just figuring out operations and culture • New schools must develop a purposeful culture grounded in the theory of action and where everyone shares responsibility for implementation. Coherence is a lot of work.
Key District Policy Supports for Schools Provide support and flexibility Network Executive Officers serve as thought-partners rather than compliance officers to school leaders Embrace entrepreneurial ethos of small school principals; support innovation Coaches support standards-based instruction and collaborative inquiry Incubate new schools and leaders Continue to strengthen BTSA model by investing in coaches and their training Develop incentives for developing / keeping strong teachers and attracting them to high-priority schools Examine leadership, working conditions, hiring, and mentoring in high-turnover schools Strengthen coaching support for all new teachers Provide service and support orientation, especially in HR Streamline hiring process Continue to move up hiring window to recruit top-quality candidates Prioritize hiring experienced, qualified teachers wherever possible Evaluate teacher pipelines in terms of retention and effectiveness and further develop strong pipelines, including “grow your own” models Identify and recruit strong student teachers
Quality Options Empowered School Leaders Personalized Learning Expect Success Performance Accountability Standards Based Instruction Technology Paper to computer Manual to automated Sustainable systems Smart use of data Expect Success Reform: 2003-10 Dollars follow students More equitable funding More flexibility in spending Families make choices District manages school portfolio Small class sizes & schools Small learning communities Small principal networks Investment in people Service Standards Transparent scorecards Public results Standards-Based Pacing & Assessments Collaborative Teacher Inquiry (PLC) Targeting Curriculum & PD
Swun Math Program Overview A highly-effective and coherent math model with alignment in standards, curriculum, assessments, professional development and accountability measures.
Swun Math Partnership with OUSD • Thoughtful and careful phased expansion • Consistent, differentiated and ongoing PD for teachers and principals • Site support and coaching for teachers and principals to connect and build on the PD provided (lesson modeling, co-teaching/elbow teaching, observations & feedback, debrief) • Training and certification process of district math coaches to ensure high quality services provided • District Math Pacing Guides (K-7) aligned with CST & district textbooks • Instructional strategies (manuals and PowerPoint) • Supplemental lessons for standards weakly addressed in textbook • Progress monitoring check-ins with district administrators and principals • Practice trimester exams that help teachers backwards plan and calibrate their understanding of the expected rigor • Reliable common summative district math assessments (K-7) • Formative unit assessments aligned with pacing guides • District-wide Beyond the Basic Facts Math Competitions (Grades 3, 5, and 6) • Beyond the Basic Facts Parent Workshops (ES & MS) • Summer school/intervention pacing guides, pre-/post-assessments • Math teacher leader training to build site capacity
Oakland Unified School DistrictCST Math 2007-2010 (by school) Percent of School Proficient and Advanced in Math Before Swun Math Implementation After Swun Math Implementation 2007-2010
Oakland Unified School DistrictCST Math 2008-2010 (by school) Percent of School Proficient and Advanced in Math Before Swun Math Implementation After Swun Math Implementation 2008-2010
Oakland Unified School DistrictCST Math 2009-2010 (by school) Percent of School Proficient and Advanced in Math Before Swun Math Implementation After Swun Math Implementation 2009-2010
Oakland Unified School DistrictCST Math 2009-2010 (by school) Percent of School Proficient and Advanced in Math Before Swun Math Implementation After Swun Math Implementation 2008-2010