Download
1 / 1
40 likes | 324 Vues
Wind flow simulations on forested zone have been performed with Computational Fluid Dynamics (CFD) software meteodyn WT, which allows introducing a custom forest canopy model. The influence of parameter changes on results is investigated. The calibration of model parameters is done by minimizing the error between the CFD results and the vertical wind profiles given by the European standard Eurocode 1 (EC1), applied to standard terrains for high roughness cases. The calibrated model shows good coherence with EC1. To check the validity of the forest modeling in the real case, CFD simulation has been performed on a site with heterogeneous forest covering. The computed wind characteristics are then compared to met mast measurement. The comparison shows good agreement on wind shear and turbulence intensity between the simulation results and the measured data.

E N D
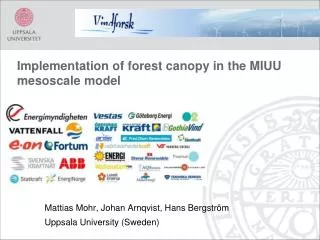
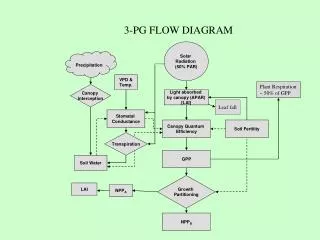
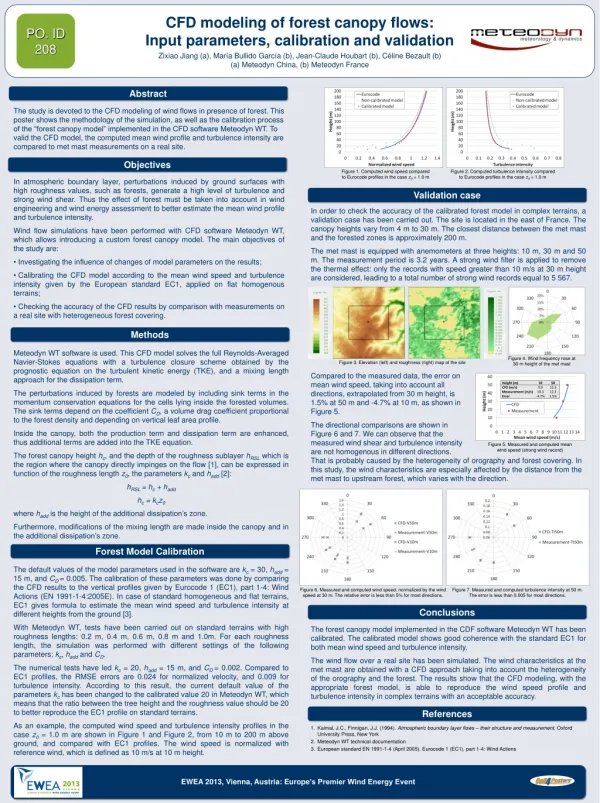
CFD modeling of forest canopy flows:Input parameters, calibration and validation Zixiao Jiang (a), María Bullido García (b), Jean-Claude Houbart (b), Céline Bezault (b)(a) Meteodyn China, (b) Meteodyn France PO. ID 208 Abstract The study is devoted to the CFD modeling of wind flows in presence of forest. This poster shows the methodology of the simulation, as well as the calibration process of the “forest canopy model” implemented in the CFD software Meteodyn WT. To valid the CFD model, the computed mean wind profile and turbulence intensity are compared to met mast measurements on a real site. Objectives Figure 1. Computed wind speed compared to Eurocode profiles in the case z0 = 1.0 m Figure 2. Computed turbulence intensity compared to Eurocode profiles in the case z0 = 1.0 m • In atmospheric boundary layer, perturbations induced by ground surfaces with high roughness values, such as forests, generate a high level of turbulence and strong wind shear. Thus the effect of forest must be taken into account in wind engineering and wind energy assessment to better estimate the mean wind profile and turbulence intensity. • Wind flow simulations have been performed with CFD software Meteodyn WT, which allows introducing a custom forest canopy model. The main objectives of the study are: • Investigating the influence of changes of model parameters on the results; • Calibrating the CFD model according to the mean wind speed and turbulence intensity given by the European standard EC1, applied on flat homogenous terrains; • Checking the accuracy of the CFD results by comparison with measurements on a real site with heterogeneous forest covering. Validation case In order to check the accuracy of the calibrated forest model in complex terrains, a validation case has been carried out. The site is located in the east of France. The canopy heights vary from 4 m to 30 m. The closest distance between the met mast and the forested zones is approximately 200 m. The met mast is equipped with anemometers at three heights: 10 m, 30 m and 50 m. The measurement period is 3.2 years. A strong wind filter is applied to remove the thermal effect: only the records with speed greater than 10 m/s at 30 m height are considered, leading to a total number of strong wind records equal to 5 567. Methods Meteodyn WT software is used. This CFD model solves the full Reynolds-Averaged Navier-Stokes equations with a turbulence closure scheme obtained by the prognostic equation on the turbulent kinetic energy (TKE), and a mixing length approach for the dissipation term. The perturbations induced by forests are modeled by including sink terms in the momentum conservation equations for the cells lying inside the forested volumes. The sink terms depend on the coefficient CD, a volume drag coefficient proportional to the forest density and depending on vertical leaf area profile. Inside the canopy, both the production term and dissipation term are enhanced, thus additional terms are added into the TKE equation. The forest canopy height hc, and the depth of the roughness sublayer hRSL which is the region where the canopy directly impinges on the flow [1], can be expressed in function of the roughness length z0, the parameters kc and hadd [2]: hRSL = hc + hadd hc = kcz0 where hadd is the height of the additional dissipation’s zone. Furthermore, modifications of the mixing length are made inside the canopy and in the additional dissipation’s zone. Figure 4. Wind frequency rose at 30 m height of the met mast Figure 3. Elevation (left) and roughness (right) map of the site Compared to the measured data, the error on mean wind speed, taking into account all directions, extrapolated from 30 m height, is 1.5% at 50 m and -4.7% at 10 m, as shown in Figure 5. The directional comparisons are shown in Figure 6 and 7. We can observe that the measured wind shear and turbulence intensity are not homogenous in different directions. That is probably caused by the heterogeneity of orography and forest covering. In this study, the wind characteristics are especially affected by the distance from the met mast to upstream forest, which varies with the direction. Figure 5. Measured and computed mean wind speed (strong wind record) Forest Model Calibration The default values of the model parameters used in the software are kc = 30, hadd = 15 m, and CD = 0.005. The calibration of these parameters was done by comparing the CFD results to the vertical profiles given by Eurocode 1 (EC1), part 1-4: Wind Actions (EN 1991-1-4:2005E). In case of standard homogeneous and flat terrains, EC1 gives formula to estimate the mean wind speed and turbulence intensity at different heights from the ground [3]. With Meteodyn WT, tests have been carried out on standard terrains with high roughness lengths: 0.2 m, 0.4 m, 0.6 m, 0.8 m and 1.0m. For each roughness length, the simulation was performed with different settings of the following parameters: kc, hadd and CD. The numerical tests have led kc = 20, hadd = 15 m, and CD = 0.002. Compared to EC1 profiles, the RMSE errors are 0.024 for normalized velocity, and 0.009 for turbulence intensity. According to this result, the current default value of the parameters kc has been changed to the calibrated value 20 in Meteodyn WT, which means that the ratio between the tree height and the roughness value should be 20 to better reproduce the EC1 profile on standard terrains. As an example, the computed wind speed and turbulence intensity profiles in the case z0 = 1.0 m are shown in Figure 1 and Figure 2, from 10 m to 200 m above ground, and compared with EC1 profiles. The wind speed is normalized with reference wind, which is defined as 10 m/s at 10 m height. Figure 6. Measured and computed wind speed, normalized by the wind speed at 30 m. The relative error is less than 5% for most directions. Figure 7. Measured and computed turbulence intensity at 50 m. The error is less than 0.005 for most directions. Conclusions The forest canopy model implemented in the CDF software Meteodyn WT has been calibrated. The calibrated model shows good coherence with the standard EC1 for both mean wind speed and turbulence intensity. The wind flow over a real site has been simulated. The wind characteristics at the met mast are obtained with a CFD approach taking into account the heterogeneity of the orography and the forest. The results show that the CFD modeling, with the appropriate forest model, is able to reproduce the wind speed profile and turbulence intensity in complex terrains with an acceptable accuracy. References • Kaimal, J.C., Finnigan, J.J. (1994). Atmospheric boundary layer flows – their structure and measurement, Oxford University Press, New York • Meteodyn WT technical documentation • European standard EN 1991-1-4 (April 2005), Eurocode 1 (EC1), part 1-4: Wind Actions EWEA 2013, Vienna, Austria: Europe’s Premier Wind Energy Event