The Cocktail Party Problem
1.15k likes | 1.27k Vues
Explore diffusion patterns and time dynamics in social networks, using the Cocktail Party Problem as a case study. Discover the impact of changing relational ties on network structures over time. Learn about innovative methods to visualize and analyze evolving networks.

The Cocktail Party Problem
E N D
Presentation Transcript
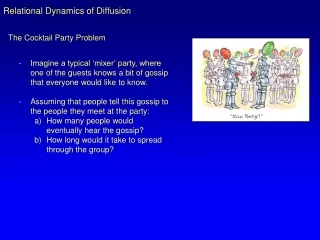
Relational Dynamics of Diffusion The Cocktail Party Problem • Imagine a typical ‘mixer’ party, where one of the guests knows a bit of gossip that everyone would like to know. • Assuming that people tell this gossip to the people they meet at the party: • How many people would eventually hear the gossip? • How long would it take to spread through the group?
Relational Dynamics of Diffusion The Cocktail Party Problem • Some specifics to narrow down the problem. • A (seemingly) simple network problem: record who talks to who, and map the network. Mean distance: 1.99 Diameter: 4 steps
Relational Dynamics of Diffusion The Cocktail Party Problem • But such an image conflates many temporally distinct events. A more accurate image is something like this: • In general, the graphs over which diffusion happens often: • Have timed edges • Nodes enter and leave • Edges can re-occur multiple times • Edges can be concurrent • These features break transmission paths, generally lowering diffusion potential – and opening a host of interesting questions about the intersection of structure and time in networks.
When is a network? Source: Bender-deMoll & McFarland “The Art and Science of Dynamic Network Visualization” JoSS 2006
When is a network? • At the finest levels of aggregation networks disappear, but at the higher levels of aggregation we mistake momentary events as long-lasting structure. • Is there a principled way to analyze (and visualize) networks where the edges are dynamic? • There is unlikely to be a single answer for all questions, but the set of types of questions might be manageable: • Structural change (networks as dynamic objects of study). • The interest is in mapping changes in the topography of the network, to see model how the field itself changes over time. • Ultimately, this has to be linked to questions about how network macro-structures emerge as the result of actor behavior rules. • Diffusion and flow (networks as resources or constraints for actors): • The timing of relations affects flow in a way that changes many of our standard measures. If our interest is in “Relational ties [as] channels for transfer or flow of resources” (W&F p.4), then we can use the diffusion process to shape our analyses.
Time and Social Networks Historically, time has been incorporated into the network by looking at (a) changes in the distribution of an item over the population, over time (I.e. the adoption of an innovation, the spread of an idea, etc.) (b) different cross-sectional slices of the network (I.e. world system in 1965, 1975, 1985 or protest networks over time). These approaches take us a long way. They don’t allow us to explicitly model the changes within the network, or explain changes in the distribution of goods as a function of relationship timing. This static bias is built into some views of the network (think of Wellman’s definition as patterns of stable relations). What we want is to be able to account for the dynamics of the network in “real time” -- to account for changes in relations as a function of changes in relations occurring around ego.
Time and Social Networks Examples of looking at change in networks: Roy and interlocking directorates (ASR 1983, 248-257) Non-financial interlocks: 1886 - 1890
Time and Social Networks Examples of looking at change in networks: Roy and interlocking directorates (ASR 1983, 248-257) Non-financial interlocks: 1891 - 1895
Time and Social Networks Examples of looking at change in networks: Roy and interlocking directorates (ASR 1983, 248-257) Non-financial interlocks: 1896 - 1900
Time and Social Networks Examples of looking at change in networks: Roy and interlocking directorates (ASR 1983, 248-257) Non-financial interlocks: 1901 - 1905
3 2 2 1 6 1 3 5 4 5 4 2 6 5 5 1 3 7 4 3 7 1 2 4 6 1 2 3 (‘81-83) 4 Bearman and Everett: The Structure of Social Protest 7 5 6 (‘66-68) (‘61-63) (‘71-73) (‘76-78) See paper for group compositions
An alternative approach to visualizing time in networks involves dynamic network displays. • Moody, McFarland and Bender-deMoll have worked on this, linked to the SoNIA software. • Theoretically, we are interested in being able to see the holistic changes in networks that might be missed with any display of summary statistics. • This involves the development of a new dynamic language for networks, moving from words describing stable ‘structures’ to words that describe change: • Pace • Tempo • Rhythm • Etc.
Freeman’s animation of change based on an early ‘email’ system in the 1970s. (note: the animation runs twice: once without groups, once by groups)
Animation as a tool: SoNIA Challenge:
Animation as a tool: SoNIA Solution:
Animation as a tool: SoNIA Challenge:
Animation as a tool: SoNIA Solution:
Animation as a tool: SoNIA Challenge:
Animation as a tool: SoNIA Solution:
Animation as a tool: SoNIA Challenge:
Animation as a tool: SoNIA Solution:
Representing dynamic networks? Animation captures much of the dynamism we care about: STD Diffusion http://csde.washington.edu/statnet/movies/ConcurrencyAndReachability.mov
Representing dynamic networks? Animation captures much of the dynamism we care about:
Representing dynamic networks? Animation captures much of the dynamism we care about:
Doreian, Kapuscinski, Krackhardt & Szczypula:A breif history of balance through time. Reanalyzes the Newcomb fraternity data, to look at changes in social balance over time. The basic balance theory hypothesis is that people who find themselves in an unbalanced position should change their relations to generate balance. Hypothetically, this should lead to greater balance over time. After discussing a set of problems imposed because the data are forced ranks, they first look at simple reciprocity.
Doreian, Kapuscinski, Krackhardt & Szczypula:A brief history of balance through time.
Doreian, Kapuscinski, Krackhardt & Szczypula:A brief history of balance through time.
Doreian, Kapuscinski, Krackhardt & Szczypula:A brief history of balance through time. Relational Stability 40 30 % Change in ties 20 10 0 1 2 3 4 5 6 7 8 9 10 11 12 13 14 Week
An extension: A balance model of friendship change among adolescents The basic hypothesis of social balance is that people will make choices that bring the entire group into balance. But, consider how a given relationship looks from different perspectives: A transition that generates transitivity for one person can generate intransitivity for another. As such, there is no guarantee that friendship change will result in a globally balanced outcome.
Here, we see that it is possible, even within the triad, for a transition to be transitive, but the state to be negative, which implies that one person’s transitive change is another’s intransitive.
Representing dynamic networks? Animation captures much of the dynamism we care about: Seeking Social Balance Source: Moody, James, Daniel A. McFarland and Skye Bender-DeMoll (2005) "Dynamic Network Visualization: Methods for Meaning with Longitudinal Network Movies” American Journal of Sociology 110:1206-1241
Representing dynamic networks? The Balance Model works for objects too: Achieved Characteristics – ties from circles to squares can change Source: Moody, James, Daniel A. McFarland and Skye Bender-DeMoll (2005) "Dynamic Network Visualization: Methods for Meaning with Longitudinal Network Movies” American Journal of Sociology 110:1206-1241
Representing dynamic networks? The Balance Model works for objects too: Ascribed Characteristics – ties from circles to squares cannot change Source: Moody, James, Daniel A. McFarland and Skye Bender-DeMoll (2005) "Dynamic Network Visualization: Methods for Meaning with Longitudinal Network Movies” American Journal of Sociology 110:1206-1241
Representing dynamic networks? The Balance Model works for objects too: Democrat Smoke What happens next? Source: Moody, James, Daniel A. McFarland and Skye Bender-DeMoll (2005) "Dynamic Network Visualization: Methods for Meaning with Longitudinal Network Movies” American Journal of Sociology 110:1206-1241
Selection or Influence? Willard Van Quine, professor of philosophy and mathematics emeritus from Harvard University who is regarded as one of the four most famous living philosophers in the world, wrote his doctoral thesis on a 1927 Remington typewriter, which he still uses. However, he "had an operation on it" to change a few keys to accommodate special symbols. "I found I could do without the second period, the second comma -- and the question mark.” "You don't miss the question mark?” "Well, you see, I deal in certainties."
Selection or Influence? • Selection • That some unobserved factor, z, creates both friendships and the outcome of interest. • Endogeneity • That the causal order of peer relations and outcomes is reversed. Peers do not cause Y, but Y causes friendship relations
Selection • What do we know about how friendships form? • Opportunity / focal factors • - Being members of the same group • - In the same class • - On the same team • - Members of the same church • Structural Relationship factors • - Reciprocity • - Social Balance • Behavior Homophily • - Smoking • - Drinking
Selection How to correct this problem? • Essentially, this is an omitted variable problem, and my “solution” has been to identify as many potentially relevant alternative variables as I can find.
Endogeneity Estimated: Y = b0 + b1(P) + e where P = some peer function. But the actual model may really be: P = b’0 + b’1(Y) + e
Endogeneity Does it matter? Algebraically the relation between y and p should be direct translation of the coefficients since: The statistical problem of endogeneity is that when you estimate b’1, it does not equal 1/b1, because of our assumptions about x, and hence e. (see Joel H. Levine, Exceptions are the Rule, for a full discussion of this)
Endogeneity Fully specified peer influence models: Where W is a matrix of interpersonal weights, calculated from the friendship adjacency matrix (the mixed-regressive autoregressive peer influence model, see Friedkin 1999, chapter 2, Doreian, 1982, SMR) These models can be estimated directly with Add Health data, but again the problem is that W may be determined by Y.
Endogeneity Possible solutions: • Theory: Given what we know about how friendships form, is it reasonable to assume a bi-directional cause? That is, work through the meeting, socializing, etc. process and ask whether it makes sense that Y is a cause of W. • Models: • - Time Order. We are on somewhat firmer ground if W precedes Y in time. Thus, using the in-school friendship structure to predict wave 1 outcomes is useful. • - Simultaneous Models. Model both the friendship pattern and the outcome of interest simultaneously.
Endogeneity • Simultaneous models: • Temporal Lag models: ERGM’s with edge/dyad covariates for prior exposure & contact. Simple & direct way to express change as a model & look for consistency • One way to do this is with SEMs, but for identification, you must find some variables that predict friendship that do not also predict Y, which given the very nature of the endogeneity problem, is hard to do. • Could also model a mixed “network” of relations and behaviors using dyads and an ERGM-style model to predict “ties” within the joint network