Cocktail Party Processing
Cocktail Party Processing. DeLiang Wang (Jointly with Guoning Hu) Perception & Neurodynamics Lab Ohio State University. Outline of presentation. Introduction Voiced speech segregation based on pitch tracking and amplitude modulation analysis

Cocktail Party Processing
E N D
Presentation Transcript
Cocktail Party Processing DeLiang Wang (Jointly with Guoning Hu) Perception & Neurodynamics Lab Ohio State University
Outline of presentation • Introduction • Voiced speech segregation based on pitch tracking and amplitude modulation analysis • Unvoiced speech segregation based on auditory segmentation and segment classification
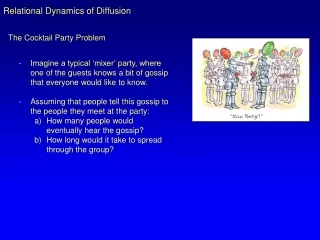
Real-world audition What? • Speech message speaker age, gender, linguistic origin, mood, … • Music • Car passing by Where? • Left, right, up, down • How close? Channel characteristics Environment characteristics • Room reverberation • Ambient noise
Speech segregation problem • In a natural environment, target speech is usually corrupted by acoustic interference, creating a speech segregation problem • Also known as cocktail-party problem (Cherry’53) or ball-room problem (Helmholtz, 1863) • Speech segregation is critical for many applications, such as automatic speech recognition and hearing prosthesis • Most speech separation techniques, e.g. beamforming and independent component analysis, require multiple sensors. However, such techniques have clear limits • Suffer from configuration stationarity • Can’t deal with situations where multiple sounds originate from same or close directions • Most speech enhancement approaches developed for monaural situation deal with only stationary acoustic interference • “No machine has yet been constructed to do just that [solving the cocktail party problem].” (Cherry’57)
Auditory scene analysis • Listeners parse the complex mixture of sounds arriving at the ears in order to form a mental representation of each sound source • This perceptual process is called auditory scene analysis (Bregman’90) • Two conceptual processes of auditory scene analysis (ASA): • Segmentation. Decompose the acoustic mixture into sensory elements (segments) • Grouping. Combine segments into groups, so that segments in the same group likely originate from the same environmental source
Computational auditory scene analysis • Computational auditory scene analysis (CASA) approaches sound separation based on ASA principles • Feature based approaches • Model based approaches • CASA has made significant advances in speech separation using monaural and binaural analysis • CASA challenges • Reliable pitch tracking of noisy speech • Unvoiced speech • Room reverberation • This presentation focuses on monaural analysis • Monaural segregation is likely more fundamental
Ideal binary mask as CASA goal • Auditory masking phenomenon: In a narrowband, a stronger signal masks a weaker one • Motivated by the auditory masking phenomenon we have suggested the ideal binary mask as a main goal of CASA • The definition of the ideal binary mask • s(t, f ): Target energy in unit (t, f ) • n(t, f ): Noise energy • θ: A local SNR criterion in dB, which is typically chosen to be 0 dB • Optimality: Under certain conditions the ideal binary mask with θ = 0 dB is the optimal binary mask from the perspective of SNR gain • It does not actually separate the mixture!
Ideal binary mask illustration Recent psychophysical tests show that the ideal binary mask results in dramatic speech intelligibility improvements (Brungart et al.’06; Li & Loizou’08)
Outline of presentation • Introduction • Voiced speech segregation based on pitch tracking and amplitude modulation analysis • Unvoiced speech segregation based on auditory segmentation and segment classification
Voiced speech segregation • For voiced speech, lower harmonics are resolved while higher harmonics are not • For unresolved harmonics, the envelopes of filter responses fluctuate at the fundamental frequency of speech • Our voiced segregation model (Hu & Wang’04) applies different grouping mechanisms for low-frequency and high-frequency signals: • Low-frequency signals are grouped based on periodicity and temporal continuity • High-frequency signals are grouped based on amplitude modulation (AM) and temporal continuity
Pitch tracking • Pitch periods of target speech are estimated from an initially segregated speech stream based on dominant pitch within each frame • Estimated pitch periods are checked and re-estimated using two psychoacoustically motivated constraints: • Target pitch should agree with the periodicity of the time-frequency units in the initial speech stream • Pitch periods change smoothly, thus allowing for verification and interpolation
Pitch tracking example (a)Dominant pitch (Line: pitch track of clean speech) for a mixture of target speech and ‘cocktail-party’ intrusion (b) Estimated target pitch
T-F unit labeling and grouping • In the low-frequency range: • A time-frequency (T-F) unit is labeled by comparing the periodicity of its autocorrelation with the estimated target pitch • In the high-frequency range: • Due to their wide bandwidths, high-frequency filters respond to multiple harmonics. These responses are amplitude modulated due to beats and combinational tones (Helmholtz, 1863) • A T-F unit in the high-frequency range is labeled by comparing its AM rate with the estimated target pitch • Labeled units are further grouped according to spectral and temporal continuity
AM example (a) The output of a gammatone filter (center frequency:2.6 kHz) in response to clean speech (b) The corresponding autocorrelation function
Outline of presentation • Introduction • Voiced speech segregation based on pitch tracking and amplitude modulation analysis • Unvoiced speech segregation based on auditory segmentation and segment classification
Unvoiced speech • Speech sounds consist of vowels and consonants; consonants further consist of voiced and unvoiced consonants • For English, unvoiced speech sounds come from the following consonant categories: • Stops (plosives) • Unvoiced: /p/ (pool), /t/ (tool), and /k/ (cake) • Voiced: /b/ (book), /d/ (day), and /g/ (gate) • Fricatives • Unvoiced: /s/(six), /sh/ (sheep), /f/ (fix), and /th/ (this) • Voiced: /z/ (zoo), /zh/ (pleasure), /v/ (vine), and /dh/ (that) • Mixed: /h/ (high) • Affricates (stop followed by fricative) • Unvoiced: /ch/ (chicken) • Voiced: /jh/ (orange) • We refer to the above consonants as expanded obstruents
How much speech is unvoiced? • Relative frequencies of unvoiced speech • For written English, the relative occurrence frequency of unvoiced consonants is 21.0% (Dewey’23) • For telephone conversations, the relative frequency of unvoiced consonants is 24.0% (French et al.’30; Fletcher’53) • In the TIMIT corpus, we found that the relative frequency of unvoiced consonants is 23.1% • Relative durations of unvoiced speech • To get an estimate on durations in conversational speech, we use median durations from a transcribed subset of the Switchboard corpus (Greenberg et al.’96) and then insert them to occurrence frequencies in telephone conversations • We performed a similar study on the TIMIT corpus • We found that the relative durations are 26.2% for conversations and 25.6% for TIMIT
Unvoiced speech segregation • Unvoiced speech constitutes a significant portion of all speech sounds • It carries crucial information for speech intelligibility • Unvoiced speech is more difficult to segregate than voiced speech • Voiced speech is highly structured, whereas unvoiced speech lacks harmonicity and is often noise-like • Unvoiced speech is usually much weaker than voiced speech and therefore more susceptible to interference
Auditory periphery • Our system models cochlear filtering by decomposing the input in the frequency domain with a bank of gammatone filters • In each filter channel, the output is divided into 20-ms time frames with 10-ms overlapping between consecutive frames • This processing results in a two-dimensional cochleagram
Auditory segmentation • Auditory segmentation is to decompose an auditory scene into contiguous T-F regions (segments), each of which should contain signal mostly from the same sound source • The definition of segmentation applies to both voiced and unvoiced speech • This is equivalent to identifying onsets and offsets of individual T-F segments, which correspond to sudden changes of acoustic energy • Our segmentation is based on a multiscale onset/offset analysis (Hu & Wang’07) • Smoothing along time and frequency dimensions • Onset/offset detection and onset/offset front matching • Multiscale integration
Smoothed intensity Utterance: “That noise problem grows more annoying each day” Interference: Crowd noise in a playground. Mixed at 0 dB SNR Scale in freq. and time: (a) (0, 0), initial intensity. (b) (2, 1/14). (c) (6, 1/14). (d) (6, 1/4)
Segmentation result The bounding contours of estimated segments from multiscale analysis. The background is represented by blue: • One scale analysis • Two-scale analysis • Three-scale analysis • Four-scale analysis • The ideal binary mask • The mixture
Grouping • Apply auditory segmentation to generate all segments for the entire mixture • Segregate voiced speech • Identify segments dominated by voiced target using segregated voiced speech • Identify segments dominated by unvoiced speech based on speech/nonspeech classification • Assuming nonspeech interference due to the lack of sequential organization
Speech/nonspeech classification • A T-F segment is classified as speech if • Xs: The energy of all the T-F units within segments • H0: The hypothesis that s is dominated by expanded obstruents • H1: The hypothesis that s is interference dominant
Speech/nonspeech classification (cont.) • By the Bayes rule, we have • Since segments have varied durations, directly evaluating the above likelihoods is computationally infeasible • Instead, we assume that each time frame within a segment is statistically independent given a hypothesis • A multilayer perceptron is trained to distinguish expanded obstruents from nonspeech interference
Speech/nonspeech classification (cont.) • The prior probability ratio of , is found to be approximately linear with respect to input SNR • Assuming that interference energy does not vary greatly over the duration of an utterance, earlier segregation of voiced speech enables us to estimate input SNR
Speech/nonspeech classification (cont.) • With estimated input SNR, each segment is then classified as either expanded obstruents or interference • Segments classified as expanded obstruents join the segregated voiced speech to produce the final output
Example of segregation Utterance: “That noise problem grows more annoying each day” Interference: Crowd noise in a playground (IBM: Ideal binary mask)
Systematic evaluation • We evaluate our system by comparing the segregated target against the ideal binary mask • Specifically, we use two error measures: • Percentage of energy loss, PEL • Percentage of noise residue, PNR • Training and test data • Speech: TIMIT corpus • Interference: 100 intrusions, including environmental sounds and crowd noise
PELand PNR Energy loss is substantially reduced due to grouping of unvoiced speech
SNR of segregated target Compared to spectral subtraction assuming perfect speech pause detection
Conclusion • A CASA approach to monaural segregation of both voiced and unvoiced speech • Segregation of voiced speech is based on pitch tracking and amplitude modulation analysis • It provides an important foundation for unvoiced speech segregation • Segregation of unvoiced speech is based on auditory segmentation and segment classification • Unvoiced speech accounts for about 21-26% of speech in terms of occurrence frequency and duration • The proposed model represents the first systematic study on unvoiced speech segregation • Although our system gives state-of-the-art performance, general cocktail party processor requires solutions to sequential organization and room reverberation
Further information on CASA • 2006 CASA book edited by D.L. Wang & G.J. Brown and published by IEEE Press/Wiley • A 10-chapter book with coherent, comprehensive, and up to date treatment of CASA