Download
1 / 7
70 likes | 73 Vues
This exhibit highlights the increasing number of uninsured women in the US, the impact of the Affordable Care Act, underinsurance among different income groups, access problems due to cost, out-of-pocket expenses, difficulty in paying medical bills, and lack of confidence in affording needed care.

E N D
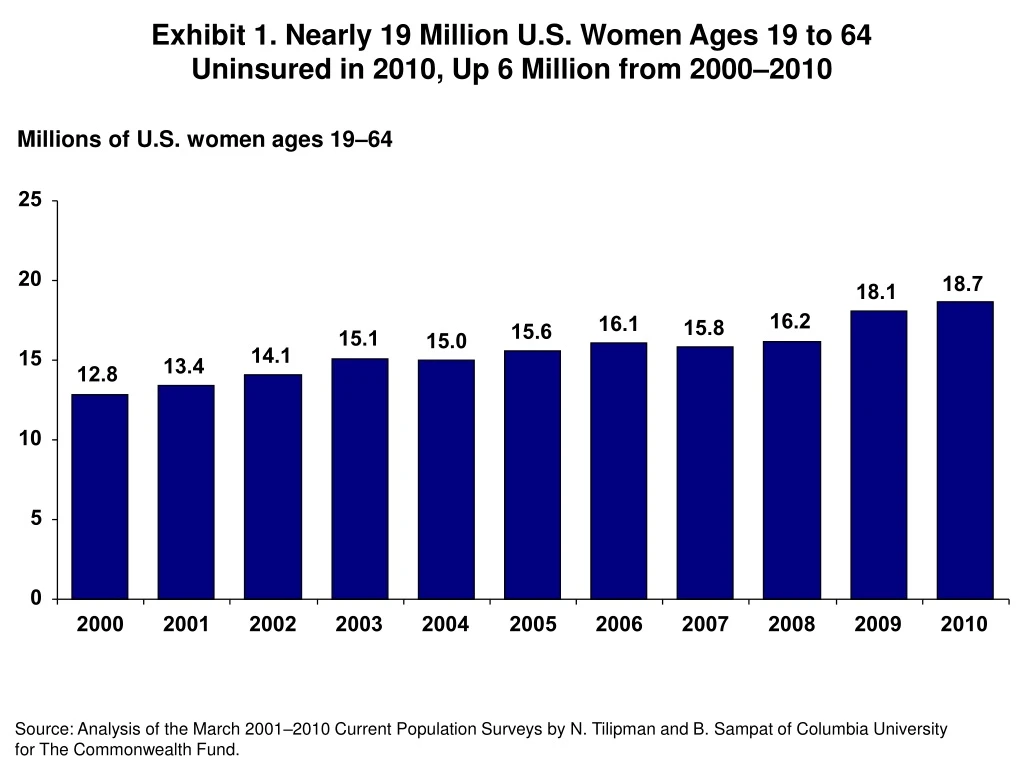
Exhibit 1. Nearly 19 Million U.S. Women Ages 19 to 64 Uninsured in 2010, Up 6 Million from 2000–2010 Millions of U.S. women ages 19–64 Source: Analysis of the March 2001–2010 Current Population Surveys by N. Tilipman and B. Sampat of Columbia University for The Commonwealth Fund.
Exhibit 2. Percent of Women Ages 19 to 64 Uninsured by State, 2009–2010 and Under the Affordable Care Act When Fully Implemented Affordable Care Act fully implemented (estimated) 2009–2010 NH VT NH WA ME VT WA ME MT ND MT ND MN OR MN NY MA NY WI OR SD ID MA WI ID MI SD RI WY MI RI PA WY NJ CT IA PA NJ CT IA NE OH DE NE OH IN NV IL DE WV MD IN NV IL UT VA MD CO DC WV UT VA MO KY KS CO CA DC MO KS KY CA NC NC TN TN SC OK AR AZ OK SC NM AZ AR GA NM AL MS GA AL MS LA TX LA TX FL FL <7% AK AK 7%–<11% HI HI 11%–<16% 8% of women ages 19–64 uninsured 20% of women ages 19–64 uninsured 16%–<21% 21%–30% Sources: Analysis of the March 2011 and 2010 Current Population Surveys by N. Tilipman and B. Sampat of Columbia University for The Commonwealth Fund; uninsured rates are two-year averages. Estimates for the Affordable Care Act when fully implemented by Jonathan Gruber and Ian Perry of MIT using the Gruber Microsimulation Model for The Commonwealth Fund.
Exhibit 3. Across Income Groups, Increasing Numbers of U.S. Women Are Underinsured Percent of U.S. women ages 19–64 who are underinsured* * Underinsured defined as insured all year but experienced one of the following: medical expenses equaled 10% or more of income; medical expenses equaled 5% or more of income if low-income (<200% of poverty); or per-person deductible equaled 5% or more of income. Note: FPL refers to federal poverty level. Source: Commonwealth Fund Biennial Health Insurance Surveys (2003, 2007, and 2010).
Exhibit 4. Women in the U.S. Report Highest Rates of Not Getting Needed Care Because of Cost Percent of women ages 19–64 who experienced any access problem because of cost in the past year* United States International * Experienced any of the following because of cost: did not fill a prescription for medicine or skipped doses; had a specific medical problem but did not visit a doctor; skipped or did not get a medical test, treatment, or follow-up that was recommended by a doctor. ** Combines “Insured now, time uninsured in past year” and “Uninsured now.” Source: 2010 Commonwealth Fund International Health Policy Survey in Eleven Countries.
Exhibit 5. Women in the U.S. Report Highest Rates of Spending $1,000 or More on Out-of-Pocket Medical Expenses Percent of women ages 19–64 who had out-of-pocket medical expenses of $1,000 or more in the past year United States International * Combines “Insured now, time uninsured in past year” and “Uninsured now.” Source: 2010 Commonwealth Fund International Health Policy Survey in Eleven Countries.
Exhibit 6. Women in the U.S. Report Problems Paying Medical Bills at More Than Double the Rate of Women in Ten Other Countries Percent of women ages 19–64 who had a serious problem paying or were unable to pay medical bills in the past year United States International * Combines “Insured now, time uninsured in past year” and “Uninsured now.” Source: 2010 Commonwealth Fund International Health Policy Survey in Eleven Countries.
Exhibit 7. Women in the U.S. Report Lowest Rates of Confidence in Their Ability to Afford Needed Care Percent of women ages 19–64 who felt confident or very confident in their ability to afford needed care if seriously ill United States International * Combines “Insured now, time uninsured in past year” and “Uninsured now.” Source: 2010 Commonwealth Fund International Health Policy Survey in Eleven Countries.