CHAPTER 17 Capital Structure Decisions: Extensions
420 likes | 603 Vues
CHAPTER 17 Capital Structure Decisions: Extensions. MM and Miller models Hamada’s equation Financial distress and agency costs Trade-off models Asymmetric information theory. Who are Modigliani and Miller (MM)?.

CHAPTER 17 Capital Structure Decisions: Extensions
E N D
Presentation Transcript
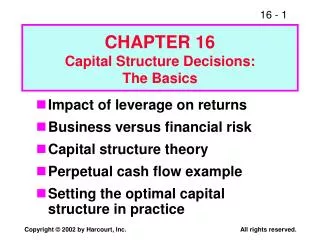
CHAPTER 17Capital Structure Decisions: Extensions • MM and Miller models • Hamada’s equation • Financial distress and agency costs • Trade-off models • Asymmetric information theory
Who are Modigliani and Miller (MM)? • They published theoretical papers that changed the way people thought about financial leverage. • They won Nobel prizes in economics because of their work. • MM’s papers were published in 1958 and 1963. Miller had a separate paper in 1977. The papers differed in their assumptions about taxes.
What assumptions underlie the MMand Miller models? • Firms can be grouped into homogeneous classes based on business risk. • Investors have identical expectations about firms’ future earnings. • There are no transactions costs. (More...)
All debt is riskless, and both individuals and corporations can borrow unlimited amounts of money at the risk-free rate. • All cash flows are perpetuities. This implies perpetual debt is issued, firms have zero growth, and expected EBIT is constant over time. (More...)
MM’s first paper (1958) assumed zero taxes. Later papers added taxes. • No agency or financial distress costs. • These assumptions were necessary for MM to prove their propositions on the basis of investor arbitrage.
MM with Zero Taxes (1958) Proposition I: VL = VU. Proposition II: ksL = ksU + (ksU - kd)(D/S).
Given the following data, find V, S,ks, and WACC for Firms U and L. Firms U and L are in same risk class. EBITU,L = $500,000. Firm U has no debt; ksU = 14%. Firm L has $1,000,000 debt at kd = 8%. The basic MM assumptions hold. There are no corporate or personal taxes.
1. Find VU and VL. EBIT ksU $500,000 0.14 VU = = = $3,571,429. VL = VU = $3,571,429. Questions: What is the derivation of the VU equation? Are the MM assumptions required?
2. Find the market value of Firm L’s debt and equity. VL = D + S = $3,571,429 $3,571,429 = $1,000,000 + S S = $2,571,429.
3. Find ksL. ksL = ksU + (ksU - kd)(D/S) = 14.0% + (14.0% - 8.0%)() = 14.0% + 2.33% = 16.33%. $1,000,000 $2,571,429
4. Proposition I implies WACC = ksU. Verify for L using WACC formula. WACC = wdkd + wceks = (D/V)kd + (S/V)ks = ()(8.0%) +()(16.33%) = 2.24% + 11.76% = 14.00%. $1,000,000 $3,571,429 $2,571,429 $3,571,429
Graph the MM relationships between capital costs and leverage as measured by D/V. Without taxes Cost of Capital (%) 26 20 14 8 ks WACC kd Debt/Value Ratio (%) 0 20 40 60 80 100
The more debt the firm adds to its capital structure, the riskier the equity becomes and thus the higher its cost. • Although kd remains constant, ks increases with leverage. The increase in ks is exactly sufficient to keep the WACC constant.
Graph value versus leverage. Value of Firm, V (%) 4 3 2 1 VL VU Firm value ($3.6 million) 0 0.5 1.0 1.5 2.0 2.5 Debt (millions of $) With zero taxes, MM argue that value is unaffected by leverage.
Find V, S, ks, and WACC for Firms U and L assuming a 40% corporatetax rate. With corporate taxes added, the MM propositions become: Proposition I: VL = VU + TD. Proposition II: ksL = ksU + (ksU - kd)(1 - T)(D/S).
Notes About the New Propositions 1. When corporate taxes are added,VL VU. VL increases as debt is added to the capital structure, and the greater the debt usage, the higher the value of the firm. 2. ksL increases with leverage at a slower rate when corporate taxes are considered.
EBIT(1 - T) ksU $500,000(0.6) 0.14 VU = = = $2,142,857. 1. Find VU and VL. Note: Represents a 40% decline from the no taxes situation. VL = VU + TD = $2,142,857 + 0.4($1,000,000) = $2,142,857 + $400,000 = $2,542,857.
2. Find market value of Firm L’s debt and equity. VL = D + S = $2,542,857 $2,542,857 = $1,000,000 + S S = $1,542,857.
3. Find ksL. ksL = ksU + (ksU - kd)(1 - T)(D/S) = 14.0% + (14.0% - 8.0%)(0.6)( ) = 14.0% + 2.33% = 16.33%. $1,000,000 $1,542,857
4. Find Firm L’s WACC. WACCL = (D/V)kd(1 - T) + (S/V)ks = ()(8.0%)(0.6) +()(16.33%) = 1.89% + 9.91% = 11.80%. When corporate taxes are considered, the WACC is lower for L than for U. $1,000,000 $2,542,857 $1,542,857 $2,542,857
MM relationship between capital costs and leverage when corporate taxes are considered. Cost of Capital (%) ks 26 20 14 8 WACC kd(1 - T) Debt/Value Ratio (%) 0 20 40 60 80 100
MM relationship between value and debt when corporate taxes are considered. Value of Firm, V (%) 4 3 2 1 VL TD VU Debt (Millions of $) 0 0.5 1.0 1.5 2.0 2.5 Under MM with corporate taxes, the firm’s value increases continuously as more and more debt is used.
Assume investors have the following tax rates: Td = 30% and Ts = 12%. What is the gain from leverage according to the Miller model? Miller’s Proposition I: VL = VU + [1 - ]D. Tc = corporate tax rate. Td = personal tax rate on debt income. Ts = personal tax rate on stock income. (1 - Tc)(1 - Ts) (1 - Td)
Tc = 40%, Td = 30%, and Ts = 12%. VL = VU + [1 - ]D = VU + (1 - 0.75)D = VU + 0.25D. Value rises with debt; each $100 increase in debt raises L’s value by $25. (1 - 0.40)(1 - 0.12) (1 - 0.30)
How does this gain compare to the gain in the MM model with corporate taxes? If only corporate taxes, then VL = VU + TcD = VU + 0.40D. Here $100 of debt raises value by $40. Thus, personal taxes lowers the gain from leverage, but the net effect depends on tax rates. (More...)
If Ts declines, while Tc and Td remain constant, the slope coefficient (which shows the benefit of debt) is decreased. • A company with a low payout ratio gets lower benefits under the Miller model than a company with a high payout, because a low payout decreases Ts.
When Miller brought in personaltaxes, the value enhancement of debt was lowered. Why? 1. Corporate tax laws favor debt over equity financing because interest expense is tax deductible while dividends are not. (More...)
2. However, personal tax laws favor equity over debt because stocks provide both tax deferral and a lower capital gains tax rate. 3. This lowers the relative cost of equity vis-a-vis MM’s no-personal-tax world and decreases the spread between debt and equity costs. 4. Thus, some of the advantage of debt financing is lost, so debt financing is less valuable to firms.
What does capital structure theoryprescribe for corporate managers? 1. MM, No Taxes: Capital structure is irrelevant--no impact on value or WACC. 2. MM, Corporate Taxes: Value increases, so firms should use (almost) 100% debt financing. 3. Miller, Personal Taxes: Value increases, but less than under MM, so again firms should use (almost) 100% debt financing.
Do firms follow the recommendationsof capital structure theory? • Firms don’t follow MM/Miller to 100% debt. Debt ratios average about 40%. • However, debt ratios did increase after MM. Many think debt ratios were too low, and MM led to changes in financial policies.
Define financial distress andagency costs. Financial distress: As firms use more and more debt financing, they face a higher probability of future financial distress, which brings with it lower sales, EBIT, and bankruptcy costs. Lowers value of stock and bonds. (More...)
Agency costs: The costs of managers not behaving in the best interests of shareholders and the resulting costs of monitoring managers’ actions. Lowers value of stock and bonds.
How do financial distress and agency costs change the MM and Miller models? • MM/Miller ignored these costs, hence those models show firm value increasing continuously with leverage. • Since financial distress and agency costs increase with leverage, such costs reduce the value of debt financing.
PV of agency costs PV of expected fin. distress costs VL = VU + XD - - . Here’s a valuation model which includes financial distress andagency costs: • X represents either Tc in the MM model or the more complex Miller term. • Now, optimal leverage involves a tradeoff between the tax benefits of debt and the costs associated with financial distress and agency.
Relationships between capital costs and leverage when financial distress and agency costs are considered. Cost of Capital (%) ks 14 4 WACC kd(1 - T) Debt ($) D*
Relationship between value and leverage. Note that value is maximized and WACC is minimized at the same capital structure. Value of Firm ($) 4 3 2 1 Debt ($) D*
How are financial and business risk measured in a market risk framework? ksL = kRF + (kM - kRF)bU + (kM - kRF)bU(1 - T)(D/S) = + + . (Hamada’s equation) Pure time value Business risk premium Financial risk premium
Hamada’s equation for beta: bL = + = + = + . bU Unlevered beta, which reflects the business risk of the firm Business risk bU(1 - T)(D/S) Increased volatility of the returnsto equitydue to the use of debt Financialrisk
What is the “pecking order theory”of capital structure? • Results of a survey by Donaldson and the asymmetric information theory. • Firms follow a specific financing order: • First use internal funds. • Next, draw on marketable securities. • Then, issue new debt. • Finally, and only as a last resort, issue new common stock.
Does the pecking order theory make sense? Explain.Is the pecking order theory consistent with the trade-off theory? • It is consistent with the asymmetric information theory, in which managers avoid issuing equity. • It is not consistent with trade-off theory.
What is the asymmetric information theory of capital structure? • Theory recognizes that market participants do not have homogeneous expectations--managers typically have better information than investors. • Thus, financing actions are interpreted by investors as signals of managerial expectations for the future. (More...)
Managers will issue new common stock only when no other alternatives exist or when the stock is overvalued. • Investors recognize this, so new stock sales are treated as negative signals and stock price falls. • Managers do not want to trigger a price decline, so firms maintain a reserve borrowing capacity.