
chart - writing
chart - writing. Chart 1: æ ¹æ®æ‰€ç»™å›¾è¡¨ï¼Œç®€è¦æè¿°æŸåŸŽå¸‚è¿‘å¹´æ¯ç™¾äººæ‰‹æœºï¼ˆ mobile phone )用户增长情况,并试分æžå…¶å¢žé•¿åŽŸå› 。. Chart 2: ä½ æ ¡æœ€è¿‘å¯¹å¦ç”Ÿè¿›è¡Œä¸Šç½‘目的进行了一次调查。 è¯·æ ¹æ®è°ƒæŸ¥ç»“果(如下表),进行简è¦æ述,并é˜è¿°ä½ 对å¦ç”Ÿä¸Šç½‘的看法。. topic sentence. The structure of chart writing. description of the chart. opinion. the content of chart writing:. Description of the chart.

chart - writing
E N D
Presentation Transcript
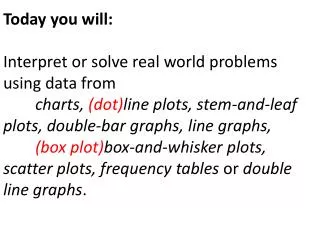
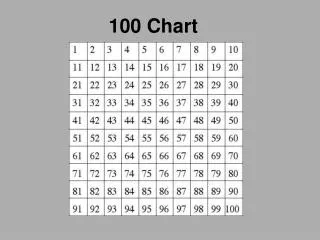
Chart 1:根据所给图表,简要描述某城市近年每百人手机(mobile phone)用户增长情况,并试分析其增长原因。
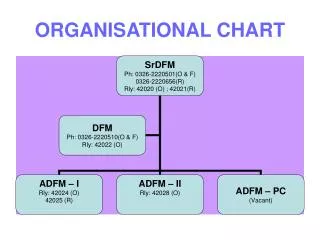
Chart 2:你校最近对学生进行上网目的进行了一次调查。 请根据调查结果(如下表),进行简要描述,并阐述你对学生上网的看法。
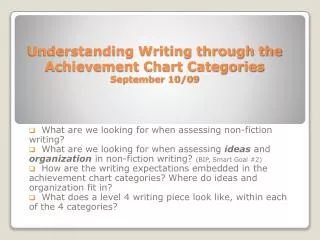
topic sentence The structure of chart writing description of the chart opinion
the content of chart writing: Description of the chart What to write Express one’s opinion
Description of number: 1% of people, one person in a hundred, one of a hundred, one out a hundred, One third of people Two thirds A half of people A quarter of people Most/few /the rest of people
Description of increase: sentence pattern: take up there are ..people doing … v: adj. 比较级+than…, a is ...times as much/many as b. adj.: adv: seldom ,always, often sometimes
The beginning of the survey: “如图所示”: 1. According to the chart, we can see that … 2. The chart shows that … 3. From the chart, we can see clearly that … 4. As is shown in the chart, … 5. As shown in the chart, … 6. The picture intends to tell us that…
Chart 1 Q1: What does the chart show us? Q2: How do you describe it?
Chart 1: increase of mobile phone users 1995 1997 1999 2001 Year The number of people 1 10 20 50
Description of increase: sentence pattern: v: increase to/by/from…to…, rise/reach/go up to adj. 比较级+than…, a is ...times as much/many as b. adj.: adv: gradually, rapidly, little by little … an increasing trend, on the rise n:
Fill in the blanks according to the chart Specific description: one person in a hundred • In 1995, had a mobile phone. • b. In 1997, the number reach up 10 percent. • In 1997, the number increased9 percent. • c. The number from 1% in 1995 to 10% in 1997. • d. In 1999, the number was as large as that of 1997. • e. There is a generally increasing from 1%to 50% between 1995 and 2001. to by increased twice trend
General description: • The number of people who used mobile • phones has increased . • b.people have mobile phones in the past two years. • c. There are people owning mobile phones than before. • d. Compared with the past, the number of people owning mobile phones is . • e. Mobile phones plays • in our daily life. rapidly More and more more larger a more important part
The beginning of the survey: “如图所示”: 1. According to the chart, we can see that … 2. The chart shows that … 3. From the chart, we can see clearly that … 4. As is shown in the chart, … 5. As shown in the chart, … 6. The picture intends to tell us that…
the content of chart writing: Description of the chart What to write Express one’s opinion
Read the following sentences and make a correct order. • Besides, people can communicate with • others conveniently. • b. Secondly, people’s income has been • increasing quickly. • c. There three reasons for the increase of the number of people having mobile phones. • d. Firstly, the technology of making mobile phones is changing rapidly. c d b a
There are several reasons for the increase of the number of people having mobile phones. Firstly, the technology of making mobile phones is changing rapidly. Secondly, people’s income has been increasing quickly. Besides, they can communicate with others very conveniently.
topic sentence The structure of chart writing description of the chart opinion
Chart 2: Q1: What does the chart show us? Q2: How do you describe it?
Proportion of activities Chart 2: activity proportion
Sample 1: As shown in the chart, the students who play games take up 40%. Chatting on the internet takes up 30%. Using internet to send email takes up 20% and only 10% of them study on it.
Sample 2: As is shown in the chart, different students have different choices in using the computers. What the students like to do most is playing games. The students who chat on the internet take up about one third. About 20% of the students use Internet as a tool to chat and fewer students make use of computers or Internet on their studies.
Description of a pan- chart: one third of the students, 20% of the students, 数字表达的变化: adj. 比较等级,like most, fewer, favorite…. v.词组,take up, use…to…,make use of, like… 句型的变化: 具体描写与概括描写的变化: The students who chat on the internet take up about one third. About 20% of the students use Internet as a tool to chat. specific: general: Different students have different choices in using the computers. What the students like to do most is playing games.
Summary: 特点:项目多,数字多。 策略: 可用列举,具体描写。 善用比较,学会概括。
write down a topic sentence and proper conjunctive words to make the passage complete. . , what information that they get on Internet must be instructive and healthy. , students mustn’t be addicted in Internet. In my opinion, Internet is helpful, but middle school students should use it wisely For one thing For another thing
Summary: 明确观点,首句提出, 列出原因,围绕中心, 逐条陈述,善用连词。
topic sentence The structure of chart writing description of the chart opinion


![Content Writing Price Chart in India Explained [Detailed Guide]](https://cdn7.slideserve.com/12512150/slide1-dt.jpg)