Download
1 / 58
580 likes | 617 Vues
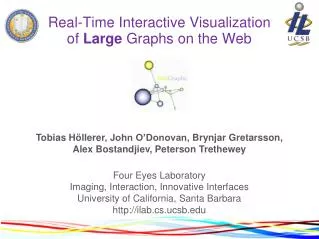
Dive into the world of visualization of large graphs and networks with insights from Tamara Munzner at Stanford University. Discover analysis of software systems, spatial layout, and visualization choices, along with novel algorithms for automatic layout and drawing.

E N D
Interactive Visualization of Large Graphs and Networks Tamara Munzner Stanford University Computer Science Department
Contributions • analysis of three software systems • relating intended tasks to spatial layout, visual encoding choices • two novel layout/drawing algorithms • scalable • targeted
general Three Visualization Systems domain specific graph drawing infovis H3 PM Const • Constellation • parsed dictionaries • refine algorithms • H3 • web hyperlinks • quasi-hierarchical • Planet Multicast • MBone tunnels • find poorly placed
Talk Outline • graph drawing, information visualization background • software systems • goal • previous work • video • discussion • evaluation • general discussion • conclusion
automatic layout and drawing of node-link graphs Gansner and North. Improved force-directed layouts. Hofstadter. Godel, Escher, Bach. Graph Drawing
Goal: help humans understand • aesthetic criteria • minimize crossings • expose structure: hierarchy, symmetry, circular Tom Sawyer Software. Hierarchical Toolkit Tom Sawyer Software. Symmetric Toolkit Tom Sawyer Software. Circular Toolkit
100 0 10 1K 10K 100K 1M 10M 100M 1B System Scalability,Data Set Size previous systems H3 data sets my systems Planet Multicast mid-size web sites Constellation Web (pages) exceptional GD systems (dot, Gem3D) MBone (tunnels) Stanford graphics site most GD systems my site Net (routers) Net (hosts) dictionary GEB figure manual node count, log scale
Fundamental Idea • extend reach of graph drawing with information visualization approach • techniques • interactivity • incorporate domain-specific information
Information Visualization • external visual representation of data, exploits perceptual system to reduce human cognitive load • find appropriate visual metaphor for data that is not implicitly spatial
Interactivity • mimic reality • 2D paper: pan, zoom • 3D object: rotate, translate, scale • beyond • semantics impossible in real world • distortion, multi-scale
Domain/Task Focus • user-centered design, ethnography • understand high level goals • maintain web site • break down into lower level tasks • minimize user navigation to important pages • find and fix broken links • design visual encoding • evaluate effectiveness
Evaluating Visualization Systems • quantitative algorithmic improvements • conceptual framework analysis • impact/adoption • user studies • anecdotal evidence
System 1: H3 • time: 1996-8 • data: web hyperlinks • quasi-hierarchical graphs: can find reasonable spanning tree using domain-specific information • goal: scalability • method: 3D hyperbolic
Background: Hyperbolic Space • Focus+Context distortion • project from infinite hyperbolic to finite euclidean • pick best model for useful distortion conformal: geodesics warped projective: angles warped 4x4 matrix
Background: Hyperbolic Space • exponential room in space • exponential number of tree nodes 2D hyperbolic plane hyperbolic hemisphere area exponential: 2p sinh r 2 euclidean hemisphere area geometric: 2pr 2 Thurston and Weeks, The Mathematics of Three Dimensional Manifolds, Scientific American
Previous Work: Hierarchies • hierarchies Cone Trees [Robertson, Mackinlay, Card 91] Tree Maps [Johnson, Shneiderman 91] Robertson, Mackinlay and Card. "Cone Trees: Animated 3D visualizations of hierarchical information. Johnson and Shneiderman. Treemaps: A Space-filling Approach to the Visualization of Hierarchical Information • distortion: [Furnas, Brown, Carpendale, Keahey]
Previous Work: Distortion & Hierarchy • 2D Hyperbolic Tree • [Lamping, Rao, Pirolli 94,95] • scalability analysis later • Fractal [Koike, Yoshihara 93] • SHriMP [Storey, Muller 95] • don’t scale • taxonomy [Noik 94] Lamping, Rao, and Pirolli. A Focus+Content Technique Based on Hyperbolic Geometry for Viewing Large Hierarchies.
Concurrent Work: Nicheworks • Nicheworks [Wills 97] • layout scales to 1M nodes • linked views • multiple layout approaches • very different visual metaphor Wills et al. Nicheworks.
Concurrent Work: Skeletonization • Skeletonization [Herman 98] • abstractions for tree structure Herman et al. Skeletonization
H3 Layout • novel layout algorithm detailed in thesis • hemisphere surface instead of linear circumference • bottom-up pass: compute hemisphere sizes • top-down pass: place child on parent surface
Information Density: Scale Lamping, Rao, and Pirolli. A Focus+Content Technique Based on Hyperbolic Geometry for Viewing Large Hierarchies.
Information Density: Codimension • want balance between clutter and void • topological approach to describing density • difference between structure and surrounding space sparse dense Carpendale, Cowperthwaite, and Fracchia. Extending Distortion Viewing from 3D to 2D.
Evaluation: Scalability • drawing: constant • incremental • exception: precision • layout: linear in |E| • 110,000 edges in 12 seconds given DFS input • limits: • computational: global layout in main memory • cognitive: disorientation past ~100K nodes • large neighborhood not global overview • future: landmarks, LOD, abstraction
Evaluation: Impact • product from SGI • Site Manager aimed at web content creators • bundled starting with Irix 6.3 • research use of library • interface for Skitter Internet tomography data • analysis of Autonomous System data • viewer use • 6 researchers converted data to use viewer • image use • 6 reprint requests
Evaluation: User Study • [Risden, Czerwinski, Munzner, Cook 00] • compared 3 browsers for adding content to collection of web pages snap portal (Yahoo style) XML3D: H3 + lists collapsible tree
User Study Results • reliably faster for existing category task • no decline in quality for new category task differences statistically significant differences statistically insignificant
System 2: Planet Multicast • time: 1996 • joint work: • Hoffman, Claffy, Fenner • data: MBone tunnels • task: find badly placed tunnels • goal: simple baseline • method: 3D geographic
Previous Work: Geographic Network • SeeNet3D • [Cox, Eick 95] • arcs on globe layout Cox and Eick. 3D Displays of Network Traffic. • SeeNet • [Becker, Eick, Wilks 95] • NSFNet • [Cox, Patterson 92] Becker, Eick, and Wilks. Visualizing Network Data Cox and Patterson. Visualization Study of the NSFNet.
Geographic Layout • distance as stand-in for resource usage • partially correlated • geographical determination arduous • major scalability problem • immediate comprehension • evocative, many image reprints • Wired, National Geographic • still picture captures much of function
Evaluation: Anecdotal Insights … > pen-mbone-1.sprintlink.net(204.213.238.11) dc-mbone-1.sprintlink.net(206.229.87.99) [1/64/tunnel] > elm.can.net(199.246.170.7) dc-mbone-1.sprintlink.net(206.229.87.99) [1/64/tunnel] > boston.terra.net(199.103.128.254) dc-mbone-1.sprintlink.net(206.229.87.99) [1/0/tunnel/querier] > NS.FLSIG.ORG(192.153.117.162) dc-mbone-1.sprintlink.net(206.229.87.99) [1/64/tunnel] > ace.mid.net(198.247.225.251) dc-mbone-1.sprintlink.net(206.229.87.99) [1/64/tunnel] > fw-mbone-1.sprintlink.net(206.61.106.99) dc-mbone-1.sprintlink.net(206.229.87.99) [1/16/tunnel] > gateway10.crawford.com(198.69.210.2) dc-mbone-1.sprintlink.net(206.229.87.99) [1/32/tunnel] > csce-2--rngm-nb-f-1.net.tamu.edu(128.194.1.11) dc-mbone-1.sprintlink.net(206.229.87.99) [1/64/tunnel] ...
System 3: Constellation • time: 1998-9 • joint work: • Guimbretière • data: MindNet query results • task: plausibility checking for linguists • method: 2D custom • goal: targeted
Definition Graph • dictionary entry sentence • nodes: word senses • links: relation types
Semantic Network • definition graphs as building blocks • unify shared words • large network • millions of nodes • grammar checking now, translation future • global structure known: dense • probes return local info
Path Query • best N paths between two words • words on path itself • definition graphs used in computation
Task: Plausibility Checking • paths ordered by computed plausibility • researcher hand-checks results • high-ranking paths believable? • believable paths high-ranked? • stop words
Goal • create unified view of relationships between paths and definition graphs • shared words are key • thousands of words (not millions) • special-purpose algorithm debugging tool • not understand the structure of English
Previous Work: Semantic Networks • SemNet • [Fairchild, Poltrock, Furnas 88] • multiple 3D layouts • Visual Thesaurus • [Thinkmap applet] • casual browsing, constant motion • < 20 nodes Fairchild, Poltrock, and Furnas. SemNet: Three-Dimensional Graphic Representations of Large Knowledge Bases. Thinkmap applet. www.thinkmap.com cited 3/09/00.
Traditional Layout • avoid crossings • reason: avoid false attachments A A B B C D C artifact salience ambiguity
Information Visualization Approach • spatial position is strongest perceptual cue • encode domain specific attribute • plausibility gradient
Constellation Semantic Layout • novel layout algorithm detailed in thesis • paths as backbone, definition graphs attached • curvilinear grid • iterative design for maximum semantics with reasonable information density • allow crossings for long-distance proxy links
Selective Emphasis • highlight sets of boxes and edges • interaction • additional perceptual channels • avoid perception of false attachments
dot H3 Evaluation: Layout Comparison
Talk Outline • graph drawing background • software systems • goal • previous work • video • discussion • evaluation • general discussion • conclusion
Visual Salience • Planet Multicast • long-distance tunnels • H3 • distant points of possible interest • fringe: aggregate information • Constellation • selective emphasis • word size tied to importance