Barometer Lab
This project investigates the relationship between air pressure and climate by measuring air pressure changes in Cumbayá over a week. The study aims to determine how weather affects air pressure, analyzing data collected at consistent times each day. Observations reveal significant correlations between air pressure readings and weather conditions, suggesting high air pressure often correlates with clear weather while low pressure indicates cloudy, rainy conditions. The findings emphasize the importance of monitoring weather conditions to predict changes in air pressure effectively.


Barometer Lab
E N D
Presentation Transcript
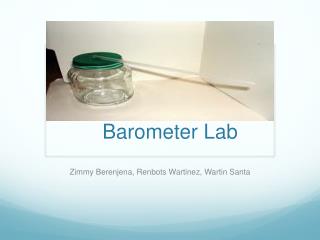
Barometer Lab By: Joaquin Bustamante, Rafaela Tamayo and Mateo Molina
Problem • What is the relationship between air pressure and climate?
Background • Answers to “air pressure” handout • 1. Altitude is greater at point A • 2. Air pressure is greater at point B • 3. Density of air is greater at B • 4. A cubic meter of air has less mass at point A • 5. 21% of oxygen
Background • 6. State three properties of air. • Air has molecules, therefore a mass. • Air has density. • Air has pressure. • 7. Why doesn’t air pressure crush objects such as your desk • Air doesn’t crush objects such as a desk because air pushes in all directions. • 8. What two units of air pressure are used in weather reports? • The two units that are used in measuring air pressure are millibars and inches of mercury.
Background • 9. C • 10. F • 11. G • 12. D • 13. A • 14. E • 15. B
Variables • The time of day is the independent variable and the air pressure is the dependent variable. In other words, the air pressure changes depending on the temperature and density of the air. One controlled variable is altitude.
Hypothesis • If we measure the air pressure in the morning and in the afternoon, then the air pressure will stay the same unless there is a change in the weather because the change in the weather affects air pressure.
Data Collection Air pressure in Cumbayá from May 14 to May 20
Data Collection Real pressure Air pressure in Cumbayá from May 14 to May 20
Data Analysis Air pressure (cm) Time in days (am: 6 30 pm: 7 00)
Data Analysis with real values Air pressure from May 14 to May 20 Air pressure (hPa) Time in days Time (am: 6 30 pm: 7 00)
Questions • 2. From the graph, what can you conclude about changes in air pressure? • I can conclude, based on my graph, that if there if there is no change in the weather there is no change in the pressure. Also that the night and morning pressures are close unless there is a huge change in the weather such as rain. • How many data points were you able to collect? Do you think this is enough data to make conclusions about air pressure and weather changes? • I was able to recollect fourteen samples (7 in the morning and 7 in the afternoon) in a period of 7 consecutive days. I think this is enough data to have an accurate result because it is the period of one whole week, which provides an accurate idea of the pressure.
Questions • Why was it important to record observations about the weather conditions? • It was important to recollect observations about weather conditions because in that way we learn how air pressure is related to weather. With this technique we should be able to predict weather. • Was your data reliable? Explain why or why not. • I think my data was reliable for three main reasons. First I took my measurements at the same time everyday. Second of all because I read always using the same part of the straw (the top). And the third and most important because I also used a real barometer for my measurements, this guarantee me that the changes in the air pressure were accurate (the numbers were not the same but the changes were).
Questions • 6. Was your data accurate? Explain why or why not. • I think that my data was accurate because I read the measurements at eye sight and always using the top of the straw. I was very careful and wrote down the information immediately. I doubled check that the measurement was true. • 7. What change in atmospheric conditions must occur to cause the free end of the straw to rise? What change must occur for it to fall? • For the free end of the straw to rise the atmospheric pressure must increase, because the air presses the balloon causing the free end of the straw to rise. And for the straw to fall the pressure must decrease because the air inside the jar will want to escape therefore the balloon will rise causing the free end of the straw to fall.
Questions • 8. According to your observations, what kind of weather is usually associated with high air pressure? With low air pressure? • According to my observations high pressure is usually associated with good (sunny, clear) weather. And low pressure is associated with bad (rainy, cloudy) weather. • 9. If your balloon had a tiny hole in it, what would happen the accuracy of your barometer? • If the barometer had a tiny hole the accuracy will be lost because the air trapped inside the jar will escape, making the air pressure inside the jar the same as the one outside. It will be unable to detect changes in the air pressure
Questions • 10. What effect, if any, would a great temperature change have on the accuracy of your barometer? Explain. • If there is a great temperature change the accuracy of the barometer will be affected. This would happen because our barometer is really simple and the materials the barometer is made out are affected by temperature. In other aspects a professional barometer would not be affected by temperature change.
Conclusion • Based on our results we can conclude many things. Our results support our hypothesis because we predicted that the air pressure will stay the the same unless there was a climate change. In our results we can see that must of the measurements are close and are related with good, sunny and clear days. WE can also see that in the day thatrained there was a air pressure change, the pressure decreased dramatically. • Our results are pretty accurate. We can see that high pressure is associated with good, sunny days and low pressure is associated with bad, cloudy, rainy days. We can also see that the air pressure can vary in the same day causing multiple weathers. Like for example May 19 had a low pressure in the morning, but in the night it had a higher pressure; therefore we can say that the morning was rainy, but the afternoon was clear. • In this lab we had many sources of possible error. The first one is that the readings in the barometer could have being mistaken because it is easy to change where you read you data (at the top of the straw or at the bottom of the straw). The second source of error is that the readings were not at the same time of day causing it to be inaccurate. Another possible source of error is that the barometer and the scale were not taped, they could have moved.