Global Drifter Program (GDP)
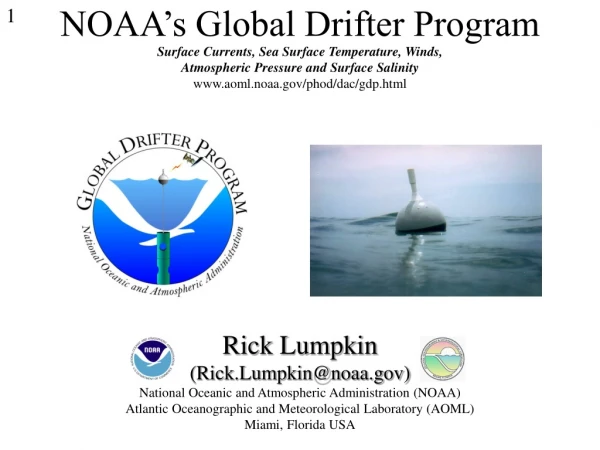
Global Drifter Program (GDP). Drifter Measurements of Surface Velocity, SST and Atmospheric Pressure. Rick Lumpkin National Oceanic and Atmospheric Administration (NOAA) Atlantic Oceanographic and Meteorological Laboratory (AOML) Miami, Florida USA. Data Buoy Cooperation Panel (DBCP)

Global Drifter Program (GDP)
E N D
Presentation Transcript
Global Drifter Program (GDP) Drifter Measurements of Surface Velocity, SST and Atmospheric Pressure Rick Lumpkin National Oceanic and Atmospheric Administration (NOAA) Atlantic Oceanographic and Meteorological Laboratory (AOML) Miami, Florida USA Data Buoy Cooperation Panel (DBCP) 20th Session – October 2004 Chennai, India
GDP purpose GDP: the principal component of the Global Surface Drifting Buoy Array, a branch of NOAA’s Global Ocean Observing System (GOOS) and Global Climate Observing System (GCOS) and a scientific project of the DBC. Objectives: Maintain a global 5ºx5º array of ARGOS-tracked Lagrangian surface drifting buoys to meet the need for an accurate and globally dense set of in-situ observations: mixed layer currents, SST, atmospheric pressure, winds, and salinity. Provide data processing system for scientific use of these data. These data support short-term (seasonal-to-interannual) climate predictions as well as climate research and monitoring.
The GDP is managed with close cooperation between: • Manufacturers in private industry: build the drifters according to closely monitored specifications • NOAA’s Atlantic Oceanographic and Meteorological Laboratory (AOML): coordinates deployments, processes the data, archives data at AOML and at MEDS (Canada), maintains META files describing each drifter deployed, develops and distributes data-based products, updates the GDP website • NOAA’s Joint Institute of Marine Observations (JIMO): supervises the industry, upgrades the technology, purchases the drifters, develops enhanced data sets, maintains liaison with individual research programs that deploy drifters
Drifters deployed September 2003 – August 2004 Tropical Oceans (20°S – 20°N) Pacific: 169Atlantic: 100Indian: 18
Drifters deployed September 2003 – August 2004 Subtropical Southern Hemisphere (40°S – 20°S) 55 drifters deployed. Barometer upgrades: 5 (Pacific), 6 (Atlantic)
Drifters deployed September 2003 – August 2004 Southern Ocean (south of 40°S) 92 drifters deployed. Barometer upgrades: 74
2005: Goals and plans Deploy 900 Drifters in the period between October 2004 and September 2005. Up to 300 SVP buoys may be upgraded with barometers by NOAA/OGP. REACH GOAL: 1250 drifters, 5° x 5° resolution of the world’s oceans. (All plans subject to JTA negotiations) Details: Craig Engler’s talk
Other 2004 GDP Activities Scientific achievements, Technical developments.
Absolute sea level, 1992-2002 Niiler, Maximenko and McWilliams, 2004 Synthesizing different observations Drifters: in-situ currents throughout the world (but not continuous) Altimetry: continuous estimates of geostrophic currents along satellite passes (but not direct measurements, and mean is contaminated by geoid errors) Winds: can be used to estimate the main ageostrophic current. COMBINE INFORMATION!!!
Lumpkin and Garzoli, 2005 Seasonal variations of the Tropical Atlantic Drifter observations: inhomogeneous in space and time. With seasonal changes, this can create biases when averaged in boxes.
Monthly current anomalies in the ENSO region September 2004
Development of the “mini” drifter Redesigned at JIMO 40% smaller components Transmitter: 14V 4V Newer design techniques SAME DRAG AREA RATIO Cost of a drifter (approx): 2002: $2150 2003: $1800 2004: $1700
Measuring sea surface salinity with drifters GDP/SIO development Additional development at WHOI (NOPP/NASA funding). The GDP will facilitate the WHOI efforts by making SVP platforms available for testing and deployments. This is easily accomplished via Clearwater Instruments, Inc., who builds drifters for the GDP and who is an industrial partner in this WHOI/NOPP project. SVP surface float Microcat mounting assembly
Deployments and recoveriesof SVP-Microcats 2000-2004: 30 SVP-Microcats deployed - Microcat attached to surface float - launched in East China Sea - two recovered: post calibration shows no detectable shifts (<1 month)
2004-2005 plans GDP/SIO funded to build 5 pairs of SVP-Microcats. - Pairs: one with, one without pumping. Pairs will be launched from French Met office ships. - Location: west of France (e.g. Bay of Biscay). - Requested: sequential recoveries over next 12 months for post-calibration.
Our appreciation to the following Operational Partners for their contributions to GDP activities Thanks Meteo-France South African Weather Service New Zealand Met Service Australian Bureau of Meteorology Fisheries Research Institute (INIDEP) and Servicio de Hidrografía Naval, Argentina Instituto Canario de Ciencias Marinas (ICCM), Canary Islands National Institute of Oceanography (NIO) and National Institute of Ocean Technology (NIOT), India Scripps Institution of Oceanography CICESE, Mexico Voluntary Observing Ships (VOS) International Ice Patrol (IIP) United States Air Force Oregon State University US Naval Oceanographic Office United States Coast Guard INMET and Centro de Hydrografia de Marinha, Brasil United Kingdom Met Office Woods Hole Oceanographic Institution Raytheon Polar Services University of Cape Town Environment Canada And others …
Rick Lumpkin(Rick.Lumpkin@noaa.gov) National Oceanic and Atmospheric Administration (NOAA) Atlantic Oceanographic and Meteorological Laboratory (AOML) Miami, Florida USA