Download
1 / 49
490 likes | 652 Vues
Developing a Student Flow Model to Project Higher Education Degree Production: Technical and Policy Consideration. Takeshi Yanagiura Research Director Tennessee Higher Education Commission 5/21/2009 2009 SHEEO/NCES Network Conference. Main Points. Tennessee’s policy issues

E N D
Developing a Student Flow Model to Project Higher Education Degree Production: Technical and Policy Consideration Takeshi Yanagiura Research Director Tennessee Higher Education Commission 5/21/2009 2009 SHEEO/NCES Network Conference
Main Points • Tennessee’s policy issues • Student Flow Model Development • Findings • Policy Implications
Tennessee Public Higher Education System • Main Roles of THEC • Coordinating Board • Develop a statewide master plan for higher education, reinforced by funding formula and performance funding • Develop higher education budget request and recommend tuition levels • Program approval • THEC Divisions • Academic Affairs • Fiscal Affairs • Policy, Planning, and Research • Legal and Regulatory Affairs • P-16 Initiatives/GEAR UP TN
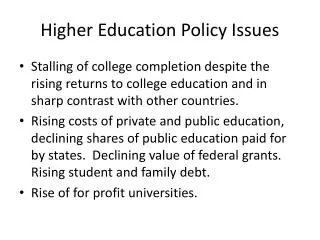
Tennessee’s Policy Interest and Issues • Increase in Educational Attainment Level • Increase in Degree Productivity • Limited Financial Support from Public Preparation are underway for 2010-2015 Master Plan • MOA • Listening tour across the state • NCHEMS Policy Audit
Tennessee’s Policy Issues: 1. Educational Attainment • Direct correlation between personal income and educational attainment of residents • TN is ranked among the bottom 10 in the nation in educational attainment
Tennessee’s Policy Issues: 3. Prospect of Declining Public Funding for Higher Education
Projections of Educational Attainment Level in US, SREB*, and Tennessee: 2007-2025 *SREB figures exclude Tennessee Source: NCHEMS
Projected Tennessee's Gaps in Educational Attainment Relative to SREB and US Averages: 2007 - 2025 Source: THEC, NCHEMS
Tennessee Imperative Improve higher education productivity Defined as “graduating more students with certificates and degrees for the money available to invest” • Participation in Making Opportunity Affordable (MOA) initiative. • MOA provides resources and a three-pronged framework to help states increase their public degree productivity: • Recast state finance systems to reward institutions for graduating students, not just enrolling them • Increase the efficiency and cost-effectiveness of academic programs and administrative operations; and • Align resources or creating new models to serve more students.
Student Flow Model • Track progress patterns of various cohorts across the state’s public higher education system • Develop enrollment and completion projections for out-years based on patterns observed in the past
Methodology • Cohort Survival Ratio • Generates enrollment and graduation projections for different student groups, based on past performance • The progression of each cohort was tracked from the fall 1997 term through spring 2007 • For each term during this time period, retention and graduation rates were calculated for every cohort • For projections of enrollment and completion beyond spring 2007, the exponential smoothing method was used
Exponential Smoothing Method • The previous two years’ retention and graduation rates were used to estimate both retention and completion rates for each future term • Projection at year t+1= (a*actual data at year t) + (1-a)*(Actual data at year t-1) • a = 0.9
Data Used to Build the Tool • Enrollment and Completion Data • All Undergraduate Fall 1997 – Spring 2007 • Following data are used: • THECID • System • Institution • Year and Term • Registration Code • Previous Registration Code • Student Level • Residency • Number of credit hours taken • College level • R&D
Cohort • A total of 12 cohorts – each cohort progresses differently - See handouts • Freshman Cohort • Recent high school graduates enrolled as first-time freshmen • with dual enrollment credit • remedial or developmental education required • non-residents • Other • Adult Students (Age 25 and Up) • 20-24 years old
Cohort (Continued) • Non-Freshman Cohort • Returning Students • Readmitted Students • Non-Degree seeking • TN Community College Transfers • Transfer from Other than TN Community Colleges • Dual Enrollment Students
High School Graduation Rate (9th Grade) Out-state Institutions Private Institutions Still Enroll at Private Institutions Attend College In-state Institutions Public Institutions Not Attend College First-timeFreshmen, Recent HS Graduate, NonResident College-Ready (R&D Not Needed) Remedial & Developmental Education Needed Adult Population (Age 25-44) without College Degree Graduate from Private Institutions Population (Age 20-24) without College Degree UT, First-time Freshmen, Recent HS Graduate TBR 2-yr, First-time Freshmen, Recent HS Graduate TBR 4yr, TBR 4-yr, First-time Freshmen, Recent HS Graduate Still Enroll at UT Graduate from UT UT, First-time Freshmen TBR 2-yr, First-time Freshmen TBR 4yr, First-time Freshmen Workforce Still Enroll atTBR 2-yr Transfer from TN Community Colleges Graduate from TBR 2-yr UT, Non-Freshman Cohort TBR 4yr, Non-Freshman Cohort TBR 2-yr, Non-Freshman Cohort Still Enroll at TBR 4yr Graduate from TBR 4-yr Dual Enroll Readmitted Other Transfer Returning Non-Degree Student Flow Model: Conceptual Image
Accuracy of the Projection • Compared predicted values to actual figures from 1997 to 2007
Actual vs. Predicted:University of Tennessee System(Enrollment) Average Error Rate = 0.2% Error Rate (%)= (Actual – Projected)/Actual
Actual vs. Predicted:University of Tennessee System(Completion) Average Error Rate = 0.4% Error Rate (%)= (Actual – Projected)/Actual
Actual vs. Predicted:Tennessee Board of Regents Universities(Enrollment) Average Error Rate = -0.1% Error Rate (%)= (Actual – Projected)/Actual
Actual vs. Predicted:Tennessee Board of Regents Universities(Completion – Bachelor Degrees) Average Error Rate = -1.4% Error Rate (%)= (Actual – Projected)/Actual
Actual vs. Predicted:Tennessee Board of Regents Universities(Completion – Associate’s Degrees) Average Error Rate = 1.0% Error Rate (%)= (Actual – Projected)/Actual
Actual vs. Predicted:Tennessee Board of RegentsCommunity Colleges(Enrollment) Average Error Rate = -0.5% Error Rate (%)= (Actual – Projected)/Actual
Actual vs. Predicted:Tennessee Board of RegentsCommunity Colleges(Completion – Associate’s Degrees) Average Error Rate = -1.8% Error Rate (%)= (Actual – Projected)/Actual
Projection Assumptions • Enrollment • Non-freshman cohort , except Community College Transfers and Dual Enrollees, will enter higher education at the same rate as in the past • For freshman cohort Age 20-24: students will enroll at the same rate as in the past • For adult students: • For-profit private institutions will increase adult enrollment by 5% every year (CAGR 2004-07 = 6.9%) • Not-for-profit private institutions will increase adult enrollment by 1% every year (CAGR 2004-07 = 4.4%) • The ratio of Fall Cohort to Spring Cohort will remain the same level of the average of previous three years
Projection Assumptions(Continued) • Completions • Private institutions’ productivity remains the same • OLS: Degree Production = intercept + a*first-time freshman fall enrollment in the same year • Productivity of the Non-Freshman cohort remains the same • Degree production of for-profit institutions is not included in the completion model
Projection Assumptions(Continued) • Transfer from Community Colleges to TBR Universities and UT • Each cohort group in TBR 2-yr institutions will transfer to these systems in the same manner in the past
Variables • A Total of 14 Variables • High School Graduation Rate (9th Grades –data source: WICHE) • College-going rate (including students attending for-profit institutions and out-state institutions. Spring cohort freshmen are also included – data source: public – THEC, others - IPEDS) • Out-migration rate of Tennessee resident, recent high school graduates • % of Recent HS Grad, Resident First-time Freshmen Attending TICUA institutions • % of freshmen (recent HS grad first-time freshmen) needing at least one remedial/developmental course • Enrollment distribution of remedial freshmen in public institutions
Variables (Continued) • Enrollment Share of Non-remedial Freshmen in Public Institutions • Non-Resident Freshmen (Recent HS Grad) as a % of Total First-time Recent HS Grad Freshmen • Age 25-44 student enrollment as a % of the same age population with high school diploma only • Enrollment Distribution of Adult Students • Dual Enrollment Participants per 100 Seniors (Both Public and Private High School) • 2nd, 3rd, and 4th Year Retention Rate
Retention Assumptions • Even if retention rates of freshman cohorts increased, retention rates of non-freshman cohorts would remain constant • For spring freshman cohorts, their retention rates increase to the extent that the retention rate of fall freshman cohort increases
Policy Goal Long Term Goal • To reach the national average of educational attainment by 2025 Short-term Goal: Focus of Master Plan • To get on the “right track” in terms of degree productivity by 2015 to reach the goal by 2025
Projections of Educational Attainment Level* in US and Tennessee: 2007-2025 269,164 additional degrees needed * Associates and up Source: NCHEMS
Additional degrees Tennessee will need to produce every year to reach average regional and national educational attainment levels by 2025 US Total: 269,164
Results:Current Projections of Degree Production(Both Public and Private*) *For-profit private institutions are not part of this analysis
Scenario 1Improvement in Pre-college factors • High School Graduation increases from 71% to 76% by 2015 • College-going Rate increases from 65% to 70% by 2015 • Out-migration rate decreases from 13% to 8% by 2015 • Dual Enrollment per 100 high school seniors increases from 16 to 26 by 2015
Scenario 1 Results:Projections of Degree Production (Both Public and Private*) *For-profit private institutions are not part of this analysis
Scenario 2Improvement in College factors • % of freshmen (recent HS grad FTF) who need at least one remedial or developmental class decreases from 33% to 23% by 2015 • Increase Retention rates
Scenario 2 Results:Projections of Degree Production(Both Public and Private*) *For-profit private institutions are not part of this analysis
Scenario 3 Results:Projections of Degree Production(Both Public and Private*) *For-profit private institutions are not part of this analysis
Student Flow Model: Usefulness as Policy Tool • Data-based tool for goal-setting • Establishes a goal for increasing degree production and a “roadmap” for getting there • Shows importance of improving performance in both K-12 and higher education • Allows responsibility for increased degree production to be assigned to various systems • Shows where improvement gives the state the greatest “return” in terms of additional degrees
Tennessee Policy Goals:To reach the regional average by 2025, how many degrees do we need to produce by 2015?
Contact Takeshi Yanagiura 615-532-8017 Takeshi.yanagiura@tn.gov Student Flow Model can be found at http://thecreports.state.tn.us/FileControl.aspx