Download
1 / 78
780 likes | 906 Vues
SPSS 201: Using SPSS to Perform Commonly Used Statistical Testing in Medical Research (Workshop). Dr. Daisy Dai Department of Medical Research. Ashley Sherman Phone: 816-701-1347 aksherman@cmh.edu Daisy Dai Phone: 816-701-5233 Email: hdai@cmh.edu. Consultation

E N D
SPSS 201: Using SPSS to Perform Commonly Used Statistical Testing in Medical Research (Workshop) Dr. Daisy Dai Department of Medical Research
Ashley Sherman Phone: 816-701-1347 aksherman@cmh.edu Daisy Dai Phone: 816-701-5233 Email: hdai@cmh.edu Consultation Experimental design and sampling plan Collaboration in presentation and publication of studies Education Research Who are biostatisticians?
SPSS 201: Using SPSS to perform statistical tests I SPSS 202: Using SPSS to perform statistical tests II SPSS 204: Using SPSS to manage data SPSS 203: Summarize data with tables and graphs STA 101: Properly Setting up and Designing a Clinical Research Study Including Power Analysis for Proper Patient Numbers (July 16th) STA 102: Commonly Used Statistical Tests in Medical Research - Part I STA 103: Commonly Used Statistical Tests in Medical Research - Part II Statistical Courses
Contents • Review statistical tools (1 hour) • Introduce SPSS (30 minutes) • Practice (1 hour) • Questions and discussions ( 30 minutes)
Medical Research • Clinical Trials • Intervention or therapeutic • Preventative • Retrospective Studies
Medical data Physics data Chemistry data Education Economics Social studies Sensory Nutrition Many more… Continuous variable Interval variable Ordinal variable Categorical variable Binary variable Discrete variable Ordinal variable Data
Information Collections • Historical Data • Pro: Convenient; Save a lot of work • Con: Outdated; Different Objectives and Designs; Unknown Detailed Information • Census • Pro: reliable, accurate and comprehensive (e.g. Population census) • Con: Time consuming; requiring more resources; difficult to investigate all subjects in the population • Sampling • Pro: Efficient; Less risky; exploratory; informative • Caveats: Selection bias; misinterpretation; design flaw
Statistics • Descriptive Statistics • Methods to organize and summarize information • Mean, median, max, min, frequency and proportions, etc. that summarize sample demographics • Inferential Statistics • Methods to draw conclusions about a population based on information obtained from a sample of the population
Population Inferential Statistics Sampling Plan Conclusion Sample Descriptive Statistics
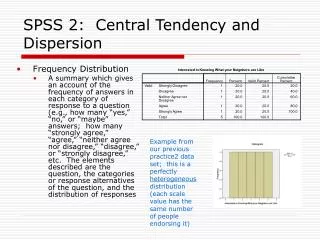
Measures of Center Mean Median: the middle value in its ordered list Mode: the most frequently occurring value Measures of variation Range: the difference between the largest and smallest value in the data set, i.e., Range=Max-Min. Standard deviation: measure variation by indicating how far, on average, the observations are from the mean. Summary Statistics We will talk more about data summary and distribution graphs in SPSS 204 Workshop.
Exercise: Determine for the mean, median and mode, which measure of center is most appropriate in the following case studies? • A student takes four exams in a biology class. His grades are 88, 75, 95, and 100. • The National Association of REALTORS publishes data on resale prices of U.S. homes. • In the 2003 Boston Marathon, there were two categories of official finishers: male and female, of which there were 10,737 and 6,309, respectively.
Statistical Testing Procedures • Clarify study objectives. • Establish hypotheses. • Determine the outcome variables, treatment groups, risk factors and covariates. • Perform appropriate statistical testing. • Interpret results.
Statistical Testing Procedures • Null Hypothesis • Ho: Mean_Treatment=Mean_Control • Alternative Hypothesis • Ha: Mean_Treatment ≠ Mean_Control (Two-sided Test) • Ha: Mean_Treatment > Mean_Control (One-sided Test) • Ha: Mean_Treatment < Mean_Control (One-sided Test) • Calculate statistics • Make Inference • If P-value > 0.05, then Ho holds • If P-value < 0.05, then Ha holds
Continuous Variables Two or multiple treatment groups
Two samples t-test Compare the means of a normally distributed interval dependent variable for two independent groups.
Case Study: FEV1 Changes asthmatic patients A new compound, ABC-123, is being developed for long-term treatment of patients with chronic asthma. Asthma patients were enrolled in a double-blind study and randomized to receive daily oral or a placebo for 6 weeks. Placebo Test FEV1 after 6-week treatment
What is the difference between std and std error? P-value P-value
Mean and Error Bar Conclusion: As compared to placebo, the new drug did not show any effect on FEV1.
Paired t-test Compare the means of a normally distributed interval dependent variable for two related groups.
Conclusion: For subjects on the new drug, FEV1 at week 6 is significantly higher than baseline. P-value
One-way ANOVA Test for differences of the means for continuous variables in multiple independent treatment groups.
Case Study: HAM-A Scores in GAD Patients with GAD A new serotonin-update inhibiting agent, SN-X95, is being studied in subjects with general anxiety disorder (GAD). Fifty-two subjects diagnosed with GAD were enrolled and randomly assigned to one of three treatment groups: three treatment groups: 25mg SN-X95, 100mg SN-X95 or placebo. After 10 weeks of once-daily oral dosing in a double-blind fashion, a test based on the Hamilton Rating Scale for Anxiety (HAM-A) was administered. This test consists of 14 anxiety-related items (e.g. ‘anxious mood’, ‘tension’, ‘insomnia’, ‘fear’, etc.), each rated by the subject as ‘no present’, ‘mild’, ‘moderate’, ‘severe’, or ‘very severe’. HAM-A test scores were founded by summing the coded values of all 14 items using the numeric coding scheme of 0 for “not present”, 1 for …. Are there any differences in means HAM-A test score among the three groups? 25mg SN-X95 100 mg SN-X95 Placebo HAM-A Score after 10-week treatment
Mean and Error Bar Conclusion: There is significant difference in mean HAM-A among three treatment at 95% confidence level.
Categorical Variables Two or multiple treatment groups
Fisher’s Exact Test A conservative non-parametric test about a relationship between two categorical variables.
Case Study: CHF Incidence in CABG after ARA A new adenosine-releasing agent (ARA), thought to reduce side effects in patients undergoing coronary artery bypass surgery (CABG), was studied in a pilot trial. Fisher’s exact test: p=0.0455
Chi-square test Test a relationship between two categorical variables. The chi-square test assumes that the expected value for each cell is five or higher.
Case Study: ADR Frequency with Antibiotic Treatment A study was conducted to monitor the incidence of GI adverse drug reactions of a new antibiotic used in lower respiratory tract infections. Chi-square test: p=0.0252; Fisher’s exact test: p=0.0385
One-way repeated measures ANOVA Repeated measures logistic regression Factorial ANOVA Friedman test Factorial logistic regression Simple Linear Regression Multiple Regression Factor analysis Multiple logistic regression Discriminant analysis One-way MANOVA Multivariate multiple regression Canonical correlation Analysis of covariance Other tests We will cover all tests including non-parametric tests in SPSS 202 Workshop.
What is SPSS? • Statistical software. • 16 server licenses. • SPSS 18.
SPSS Data Entry • SPSS data can be entered manually. • The format is ready for analysis. • SAS, Excel, txt, etc. data can be easily imported to SPSS. • SPSS data files are saved as “SPSS data document (.sav)”. • SPSS output files are saved as “SPSS viewer document (.spv)”.
SPSS Data Entry • SPSS has a few unique features in data entry. • Categorical variables need to be coded. For instance, code male as 1 and female as 0 or vice versa. • When you have two treatments, test and control, please use 1 for test and 0 for control. • Categorical variables that are not coded in other sourced data files will not be imported or analyzed properly in SPSS. • Continuous variables don’t need coding. • Missing values needs to be defined in “variable view” page.
Example: CDC Survey Data • An allergy survey was conducted in 2005 and 2006 to children more than 1 year old. • Two data sets, allergy questionnaire and demographic information, are saved in sas export format.
Tasks • Import these two SAS data files to SPSS and save them as SPSS data file. • Sort each data set by study ID. • Merge allergy variables and demographic variables. • Save new data set as SPSS data file.
Log in SPSS • CMH offers server version SPSS 18. Any employee can log in SPSS from your employee account. • Go to Start ->Program ->Accessories -> Remote Desktop Connection
Log in SPSS • In the prompted connection window, enter cmhterm. • Click Connect.
Log in SPSS • In the Log On Window, enter your cmh user name and password. • Choose log on to CMH • Click OK.
Task 1: Import Data • We need to import two data sets to SPSS. • Allergy qustionaire: aqq_d.xpt (xpt is sas export file) • Demographic information: demo_d.xpt • Please note that SPSS is on server and data must be saved in shared drive such as u drive or w drive. You will not be able to find the file in SPSS if you save them on your local disk.
Task 1: Import Data • Double click spss 18 icon on the screen. • In the task wizard, click Open an existing source. • Click OK.
Task 1: Import Data • Just in case wizard does not prompt, you can go to file -> Open -> Data
Task 1: Import Data • Select the folder. • Choose agg_d file. • Select xpt format. • Click Open. • Note: SPSS is compatible with other commonly used statistical and data management software packages. Excel, SAS, Access files are all convertible to SPSS.
Task 1: Import Data • Now the data is open. • You can see the data in “data View” tab.
Task 1: Import Data • The data structure, variable name, label, etc. are in “Variable View” tab.
Task 2: Sort Data • Variable to be sort: SEQN, that is, Respondent sequence number.