Download
1 / 39
390 likes | 425 Vues
Explore least squares curve fitting and statistical analysis in detail, with practical examples and solutions. Learn about data spread, variance, and coefficient of variation.

E N D
EE 3561 : Computational MethodsUnit 4:Least Squares Curve Fitting Dr. Mujahed Al-Dhaifallah (Term 342) Reading Assignment : 17.1 - 17.3 (c)AL-DHAIFALLAH1435
Elementary Statistics • A statistical sample is a fraction or a portion of the whole (population) that is studied. • For example Consider Table 1 which contains 14 measurements of the concentration of sodium chlorate produced in a chemical reactor operated at a pH of 7.0. (c)AL-DHAIFALLAH1435
Elementary Statistics • One of the measures of the spread of the data is the range of the data. The range is defined as the difference between the maximum and minimum value of the data as R • However, range may not give a good idea of the spread of the data as some data points may be far away from most other data points (such data points are called outliers). (c)AL-DHAIFALLAH1435
Elementary Statistics • That is why the sum of the square of the differences is considered a better measure. The sum of the squares of the differences, also called summed squared error (SSE), St , is given by • Since the magnitude of the summed squared error is dependent on the number of data points, an average value of the summed squared error is defined as the variance, σ2 (c)AL-DHAIFALLAH1435
Elementary Statistics • To bring the variation back to the same level of units as the original data, a new term called standard deviation, σ , is defined as • Furthermore, the ratio of the standard deviation to the mean, known as the coefficient of variation is also used to normalize the spread of a sample. (c)AL-DHAIFALLAH1435
Example (c)AL-DHAIFALLAH1435
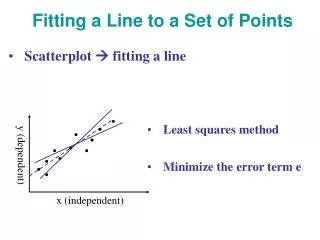
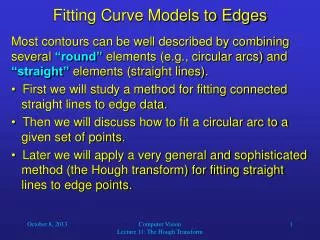
Motivation Given a set of experimental data • The relationship between x and y may not be clear • we want to find an expression for f(x) 1 2 3 (c)AL-DHAIFALLAH1435
Curve Fitting Given a set of tabulated data, find a curve or a function that best represents the data. Given: • The tabulated data • The form of the function • The curve fitting criteria Find the unknown coefficients (c)AL-DHAIFALLAH1435
Selection of the functions (c)AL-DHAIFALLAH1435
Decide on the criterion Chapter 17 Chapter 18 (c)AL-DHAIFALLAH1435
Least Squares Given The form of the function is assumed to be known but the coefficients are unknown The difference is assumed to be the result of experimental error (c)AL-DHAIFALLAH1435
Determine the Unknowns (c)AL-DHAIFALLAH1435
Determine the Unknowns (c)AL-DHAIFALLAH1435
Example 1 (c)AL-DHAIFALLAH1435
Remember (c)AL-DHAIFALLAH1435
Example 1 (c)AL-DHAIFALLAH1435
Example 1 (c)AL-DHAIFALLAH1435
Example 1 (c)AL-DHAIFALLAH1435
Example 1 (c)AL-DHAIFALLAH1435
Example 2 (c)AL-DHAIFALLAH1435
Example 2 (c)AL-DHAIFALLAH1435
Example 2 (c)AL-DHAIFALLAH1435
Example 2 (c)AL-DHAIFALLAH1435
Example 2 Solve to get (c)AL-DHAIFALLAH1435
How do you judge performance? (c)AL-DHAIFALLAH1435
Multiple Regression Example: Given the following data It is required to determine a function of two variables f(x,t) = a + b x + c t to explain the data that is best in the least square sense. (c)AL-DHAIFALLAH1435
Solution of Multiple Regression Construct , the sum of the square of the error and derive the necessary conditions by equating the partial derivatives with respect to the unknown parameters to zero then solve the equations. (c)AL-DHAIFALLAH1435
Solution of Multiple Regression (c)AL-DHAIFALLAH1435
Nonlinear least squares problems + More Examples of nonlinear least squares Solution of inconsistent equations Continuous least square problems (c)AL-DHAIFALLAH1435
Nonlinear Problem Given (c)AL-DHAIFALLAH1435
Alternative Solution(Linearization Method) Given (c)AL-DHAIFALLAH1435
Inconsistent System of Equations (c)AL-DHAIFALLAH1435
Inconsistent System of EquationsReasons Inconsistent equations may occur because of presence of noise in input or output data, or modeling error, etc. Solution if all lines intersect at one point (c)AL-DHAIFALLAH1435
Inconsistent System of EquationsFormulation as a least squares problem (c)AL-DHAIFALLAH1435
Solution (c)AL-DHAIFALLAH1435
Solution (c)AL-DHAIFALLAH1435
Examples (Linearization Method) Given (c)AL-DHAIFALLAH1435
Exercise (c)AL-DHAIFALLAH1435