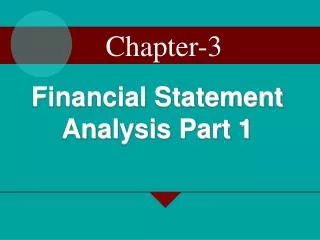
Financial Statement Analysis: Lincoln Company Horizontal Analysis 2006 vs. 2005
480 likes | 582 Vues
Explore the financial health of Lincoln Company through horizontal analysis of balance sheets and income statements for 2006 and 2005. Understand changes in assets, liabilities, equity, and profitability. Gain insights into the company's financial performance metrics.

Financial Statement Analysis: Lincoln Company Horizontal Analysis 2006 vs. 2005
E N D
Presentation Transcript
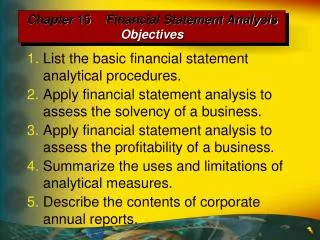
Chapter 15 - Financial Statement AnalysisObjectives 1.List the basic financial statement analytical procedures. 2.Apply financial statement analysis to assess the solvency of a business. 3.Apply financial statement analysis to assess the profitability of a business. 4.Summarize the uses and limitations of analytical measures. 5.Describe the contents of corporate annual reports.
Horizontal Analysis It’s an analysis of the percentage increases and decreases of related items in comparative financial statements.
Lincoln CompanyComparative Balance SheetDecember 31, 2006 and 2005 Balance Sheet Increase (Decrease) 2006 2005 Amount Percent Assets Current assets $ 550,000 $ 533,000 $ 17,000 3.2% Long-term investments 95,000 177,500 (82,500) (46.5%) Fixed assets (net) 444,500 470,000 (25,500) (5.4%) Intangible assets 50,000 50,000 — Total assets $1,139,500 $1,230,500 $ (91,000) (7.4%) Liabilities Current liabilities $ 210,000 $ 243,000 $ (33,000) (13.6%) Long-term liabilities 100,000 200,000 (100,000) (50.0%) Total liabilities $ 310,000 $ 443,000 $(133,000) (30.0%) Stockholders’ Equity Preferred 6% stock, $100 par $ 150,000 $ 150,000 — Common stock, $10 par 500,000 500,000 — Retained earnings 179,500 137,500 $42,000 30.5% Total stockholders’ equity $ 829,500 $ 787,500 $42,000 5.3% Total liab. & SE $1,139,500 $1230,500 $(91,000) (7.4%)
Difference $17,000 Base year (2005) $533,000 = 3.2% Lincoln CompanyComparative Balance SheetDecember 31, 2006 and 2005 Increase (Decrease) 2006 2005 Amount Percent Assets Current assets $ 550,000 $ 533,000 $ 17,000 3.2% Long-term investments 95,000 177,500 (82,500) (46.5%) Fixed assets (net) 444,500 470,000 (25,500) (5.4%) Intangible assets 50,000 50,000 — Total assets $1,139,500 $1,230,500 $ (91,000) (7.4%) Liabilities Current liabilities $ 210,000 $ 243,000 $ (33,000) (13.6%) Long-term liabilities 100,000 200,000 (100,000) (50.0%) Total liabilities $ 310,000 $ 443,000 $(133,000) (30.0%) Stockholders’ Equity Preferred 6% stock, $100 par $ 150,000 $ 150,000 — Common stock, $10 par 500,000 500,000 — Retained earnings 179,500 137,500 $42,000 30.5% Total stockholders’ equity $ 829,500 $ 787,500 $42,000 5.3% Total liab. & SE $1,139,500 $1230,500 $(91,000) (7.4%) Horizontal Analysis:
Lincoln CompanyComparative Balance SheetDecember 31, 2006 and 2005 Increase (Decrease) 2006 2005 Amount Percent Assets Current assets $ 550,000 $ 533,000 $ 17,000 3.2% Long-term investments 95,000 177,500 (82,500) (46.5%) Fixed assets (net) 444,500 470,000 (25,500) (5.4%) Intangible assets 50,000 50,000 — Total assets $1,139,500 $1,230,500 $ (91,000) (7.4%) Liabilities Current liabilities $ 210,000 $ 243,000 $ (33,000) (13.6%) Long-term liabilities 100,000 200,000 (100,000) (50.0%) Total liabilities $ 310,000 $ 443,000 $(133,000) (30.0%) Stockholders’ Equity Preferred stock, $100 par $ 150,000 $ 150,000 — Common stock, $10 par 500,000 500,000 — Retained earnings 179,500 137,500 $42,000 30.5% Total stockholders’ equity $ 829,500 $ 787,500 $42,000 5.3% Total liab. & SE $1,139,500 $1230,500 $(91,000) (7.4%) Horizontal Analysis: Difference $(82,500) Base year (2005) $177,500 = (46.5%)
Lincoln CompanyComparative Balance SheetDecember 31, 2006 and 2005 Increase (Decrease) 2006 2005 Amount Percent Assets Current assets $ 550,000 $ 533,000 $ 17,000 3.2% Long-term investments 95,000 177,500 (82,500) (46.5%) Fixed assets (net) 444,500 470,000 (25,500) (5.4%) Intangible assets 50,000 50,000 — Total assets $1,139,500 $1,230,500 $ (91,000) (7.4%) Liabilities Current liabilities $ 210,000 $ 243,000 $ (33,000) (13.6%) Long-term liabilities 100,000 200,000 (100,000) (50.0%) Total liabilities $ 310,000 $ 443,000 $(133,000) (30.0%) Stockholders’ Equity Preferred 6% stock, $100 par $ 150,000 $ 150,000 — Common stock, $10 par 500,000 500,000 — Retained earnings 179,500 137,500 $42,000 30.5% Total stockholders’ equity $ 829,500 $ 787,500 $42,000 5.3% Total liab. & SE $1,139,500 $1230,500 $(91,000) (7.4%) (5.4%)
Income Statement Lincoln CompanyComparative Income StatementDecember 31, 2006 and 2005 Increase (Decrease) 2006 2005 Amount Percent Sales $1,530,500 $1,234,000 $296,500 24.0% Sales returns 32,500 34,000 (1,500) (4.4%) Net sales $1,498,000 $1,200,000 $298,000 24.8% Cost of goods sold 1,043,000 820,000 223,000 27.2% Gross profit $ 455,000 $ 380,000 $ 75,000 19.7% Selling expenses $ 191,000 $ 147,000 $ 44,000 29.9% Administrative expenses 104,000 97,400 6,600 6.8% Total operating expenses $ 295,000 $ 244,400 $ 50,600 20.7% Operating income $ 160,000 $ 135,600 $ 24,400 18.0% Other income 8,500 11,000 (2,500) (22.7%) $ 168,500 $ 146,600 $ 21,900 14.9% Other expense 6,000 12,000 (6,000) (50.0%) Income before income tax $ 162,500 $ 134,600 $ 27,900 20.7% Income tax 71,500 58,100 13,400 23.1% Net income $ 91,000 $ 76,500 $ 14,500 19.0%
24.0% Lincoln CompanyComparative Income Statement December 31, 2006 and 2005 Increase (Decrease) 2006 2005 Amount Percent Sales $1,530,500 $1,234,000 $296,500 24.0% Sales returns 32,500 34,000 (1,500) (4.4%) Net sales $1,498,000 $1,200,000 $298,000 24.8% Cost of goods sold 1,043,000 820,000 223,000 27.2% Gross profit $ 455,000 $ 380,000 $ 75,000 19.7% Selling expenses $ 191,000 $ 147,000 $ 44,000 29.9% Administrative expenses 104,000 97,400 6,600 6.8% Total operating expenses $ 295,000 $ 244,400 $ 50,600 20.7% Operating income $ 160,000 $ 135,600 $ 24,400 18.0% Other income 8,500 11,000 (2,500) (22.7%) $ 168,500 $ 146,600 $ 21,900 14.9% Other expense 6,000 12,000 (6,000) (50.0%) Income before income tax $ 162,500 $ 134,600 $ 27,900 20.7% Income tax 71,500 58,100 13,400 23.1% Net income $ 91,000 $ 76,500 $ 14,500 19.0% Horizontal Analysis: Increase amount $296,500 Base year (2005) $1,234,000 = 24.0%
24.8% Lincoln CompanyComparative Income Statement December 31, 2006 and 2005 Increase (Decrease) 2006 2005 Amount Percent Sales $1,530,500 $1,234,000 $296,500 24.0% Sales returns 32,500 34,000 (1,500) (4.4%) Net sales $1,498,000 $1,200,000 $298,000 24.8% Cost of goods sold 1,043,000 820,000 223,000 27.2% Gross profit $ 455,000 $ 380,000 $ 75,000 19.7% Selling expenses $ 191,000 $ 147,000 $ 44,000 29.9% Administrative expenses 104,000 97,400 6,600 6.8% Total operating expenses $ 295,000 $ 244,400 $ 50,600 20.7% Operating income $ 160,000 $ 135,600 $ 24,400 18.0% Other income 8,500 11,000 (2,500) (22.7%) $ 168,500 $ 146,600 $ 21,900 14.9% Other expense 6,000 12,000 (6,000) (50.0%) Income before income tax $ 162,500 $ 134,600 $ 27,900 20.7% Income tax 71,500 58,100 13,400 23.1% Net income $ 91,000 $ 76,500 $ 14,500 19.0% Horizontal Analysis: Increase amount $298,000 Base year (2005) $1,200,000 = 24.8%
Vertical Analysis A percentage analysis can be used to show the relationship of each component to a total within a single statement. The total, or 100% item, on the balance sheet is “total assets.”
48.3% Vertical Analysis: Current assets $550,000 Total assets $1,139,500 = 48.3% Balance Sheet Lincoln CompanyComparative Balance Sheet December 31, 2006 December 31, 2005 Amount Percent Amount Percent Assets Current assets $ 550,000 48.3% $ 533,000 43.3% Long-term investments 95,000 8.3 177,500 14.4 Property, plant, & equip. (net) 444,500 39.0 470,000 38.2 Intangible assets 50,000 4.4 50,000 4.1 Total assets $1,139,500 100.0% $1,230,500 100.0% Liabilities Current liabilities $ 210,000 18.4% $ 243,000 19.7% Long-term liabilities 100,000 8.8 200,000 16.3 Total liabilities $ 310,000 27.2% $ 443,000 36.0% Stockholders’ Equity Preferred stock, 6%, $100 par $ 150,000 13.2% $ 150,000 12.2% Common stock, $10 par 500,000 43.9 500,000 40.6 Retained earnings 179,500 15.7 137,500 11.2 Total stockholders’ equity $ 829,500 72.8% $ 787,500 64.0% Total liab. & SE $1,139,500 100.0% $1,230,500 100.0%
43.3% Vertical Analysis: Current assets $533,000 Total assets $1,230,500 = 43.3% Lincoln CompanyComparative Balance Sheet December 31, 2006 December 31, 2005 Amount Percent Amount Percent Assets Current assets $ 550,000 48.3% $ 533,000 43.3% Long-term investments 95,000 8.3 177,500 14.4 Property, plant, & equip. (net) 444,500 39.0 470,000 38.2 Intangible assets 50,000 4.4 50,000 4.1 Total assets $1,139,500 100.0% $1,230,500 100.0% Liabilities Current liabilities $ 210,000 18.4% $ 243,000 19.7% Long-term liabilities 100,000 8.8 200,000 16.3 Total liabilities $ 310,000 27.2% $ 443,000 36.0% Stockholders’ Equity Preferred 6% stock, $100 par $ 150,000 13.2% $ 150,000 12.2% Common stock, $10 par 500,000 43.9 500,000 40.6 Retained earnings 179,500 15.7 137,500 11.2 Total stockholders’ equity $ 829,500 72.8% $ 787,500 64.0% Total liab. & SE $1,139,500 100.0% $1,230,500 100.0%
Lincoln CompanyComparative Balance Sheet December 31, 2006 December 31, 2005 Amount Percent Amount Percent Assets Current assets $ 550,000 48.3% $ 533,000 43.3% Long-term investments 95,000 8.3 177,500 14.4 Property, plant, & equip. (net) 444,500 39.0 470,000 38.2 Intangible assets 50,000 4.4 50,000 4.1 Total assets $1,139,500 100.0% $1,230,500 100.0% Liabilities Current liabilities $ 210,000 18.4% $ 243,000 19.7% Long-term liabilities 100,000 8.8 200,000 16.3 Total liabilities $ 310,000 27.2% $ 443,000 36.0% Stockholders’ Equity Preferred 6% stock, $100 par $ 150,000 13.2% $ 150,000 12.2% Common stock, $10 par 500,000 43.9 500,000 40.6 Retained earnings 179,500 15.7 137,500 11.2 Total stockholders’ equity $ 829,500 72.8% $ 787,500 64.0% Total liab. & SE $1,139,500 100.0% $1,230,500 100.0%
Income Statement Lincoln CompanyComparative Income StatementFor the Years Ended December 31, 2006 and 2005 2006 2005 Amount Percent Amount Percent Sales $1,530,500 102.2% $1,234,000 102.8% Sales returns 32,500 2.2 34,000 2.8 Net sales $1,498,000 100.0% $1,200,000 100.0% Cost of goods sold 1,043,000 69.6 820,000 68.3 Gross profit $ 455,000 30.4% $ 380,000 31.7% Selling expenses $ 191,000 12.8% $ 147,000 12.3% Administrative expenses 104,000 6.9 97,400 8.1 Total operating expenses $ 295,000 19.7% $ 244,400 20.4% Income from operations $ 160,000 10.7 $ 135,600 11.3% Other income 8,500 0.6 11,000 0.9 $ 168,500 11.3% $ 146,600 12.2% Other expense 6,000 0.4 12,000 1.0 Income before income tax $ 162,500 10.9% $ 134,600 11.2% Income tax expense 71,500 4.8 58,100 4.8 Net income $ 91,000 6.1% $ 76,500 6.4% Net sales is 100.0%
12.8% Lincoln CompanyComparative Income StatementFor the Years Ended December 31, 2006 and 2005 2006 2005 Amount Percent Amount Percent Sales $1,530,500 102.2% $1,234,000 102.8% Sales returns 32,500 2.2 34,000 2.8 Net sales $1,498,000 100.0% $1,200,000 100.0% Cost of goods sold 1,043,000 69.6 820,000 68.3 Gross profit $ 455,000 30.4% $ 380,000 31.7% Selling expenses $ 191,000 12.8% $ 147,000 12.3% Administrative expenses 104,000 6.9 97,400 8.1 Total operating expenses $ 295,000 19.7% $ 244,400 20.4% Income from operations $ 160,000 10.7 $ 135,600 11.3% Other income 8,500 0.6 11,000 0.9 $ 168,500 11.3% $ 146,600 12.2% Other expense 6,000 0.4 12,000 1.0 Income before income tax $ 162,500 10.9% $ 134,600 11.2% Income tax expense 71,500 4.8 58,100 4.8 Net income $ 91,000 6.1% $ 76,500 6.4% Vertical Analysis: Selling expenses $191,000 Net sales $1,498,000 = 12.8%
Lincoln CompanyComparative Income StatementFor the Years Ended December 31, 2006 and 2005 2006 2005 Amount Percent Amount Percent Sales $1,530,500 102.2% $1,234,000 102.8% Sales returns 32,500 2.2 34,000 2.8 Net sales $1,498,000 100.0% $1,200,000 100.0% Cost of goods sold 1,043,000 69.6 820,000 68.3 Gross profit $ 455,000 30.4% $ 380,000 31.7% Selling expenses $ 191,000 12.8% $ 147,000 12.3% Administrative expenses 104,000 6.9 97,400 8.1 Total operating expenses $ 295,000 19.7% $ 244,400 20.4% Income from operations $ 160,000 10.7 $ 135,600 11.3% Other income 8,500 0.6 11,000 0.9 $ 168,500 11.3% $ 146,600 12.2% Other expense 6,000 0.4 12,000 1.0 Income before income tax $ 162,500 10.9% $ 134,600 11.2% Income tax expense 71,500 4.8 58,100 4.8 Net income $ 91,000 6.1% $ 76,500 6.4%
Lincoln CompanyComparative Income StatementFor the Years Ended December 31, 2006 and 2005 2006 2005 Amount Percent Amount Percent Sales $1,530,500 102.2% $1,234,000 102.8% Sales returns 32,500 2.2 34,000 2.8 Net sales $1,498,000 100.0% $1,200,000 100.0% Cost of goods sold 1,043,000 69.6 820,000 68.3 Gross profit $ 455,000 30.4% $ 380,000 31.7% Selling expenses $ 191,000 12.8% $ 147,000 12.3% Administrative expenses 104,000 6.9 97,400 8.1 Total operating expenses $ 295,000 19.7% $ 244,400 20.4% Income from operations $ 160,000 10.7 $ 135,600 11.3% Other income 8,500 0.6 11,000 0.9 $ 168,500 11.3% $ 146,600 12.2% Other expense 6,000 0.4 12,000 1.0 Income before income tax $ 162,500 10.9% $ 134,600 11.2% Income tax expense 71,500 4.8 58,100 4.8 Net income $ 91,000 6.1% $ 76,500 6.4%
Common Size Statements Vertical analysis with both dollar and percentage amounts is also useful in comparing one company with another or with industry averages. Such comparisons are easier to make with the use of common-size statements in which all items are expressed in percentages.
Solvency Analysis • Solvencyis the ability of a business to meet its financial obligations (debts) as they are due. • Solvency analysis focuses on the ability of a business to pay or otherwise satisfy its currentandnoncurrent liabilities. • This ability is normally assessed by examining balance sheetrelationships.
Divide current assets by current liabilities Current Position Analysis Working Capital and Current Ratio 2006 2005 Current assets $550,000 $533,000 Current liabilities 210,000 243,000 Working capital $340,000 $290,000 Current ratio 2.6 2.2 Use: To indicate the ability to meet currently maturing obligations.
Current Position Analysis Quick Ratio 2006 2005 Quick assets: Cash $ 90,500 $ 64,700 Marketable securities 75,000 60,000 Accounts receivable (net) 115,000 120,000 Total $280,500 $244,700 Current liabilities $210,000 $243,000 Quick ratio 1.3 1.0 Use: To indicate instant debt-paying ability.
Net sales on account Average accounts receivable Accounts Receivable Analysis Accounts Receivable Turnover 2006 2005 Net sales on account $1,498,000 $1,200,000 Accounts receivable (net): Beginning of year $ 120,000 $ 140,000 End of year 115,500 120,000 Total $ 235,000 $ 260,000 Average (Total ÷ 2) $ 117,500 $ 130,000
Accounts Receivable Analysis Accounts Receivable Turnover 2006 2005 Net sales on account $1,498,000 $1,200,000 Accounts receivable (net): Beginning of year $ 120,000 $ 140,000 End of year 115,500 120,000 Total $ 235,000 $ 260,000 Average $ 117,500 $ 130,000 Accounts receivable turnover 12.7 9.2 Use: To assess the efficiency in collecting receivables and in the management of credit.
Accounts receivable, end of year Average daily sales on account Accounts Receivable Analysis Number of Days’ Sales in Receivables 2006 2005 Accounts receivable (net), end of year $ 115,000 $ 120,000 Net sales on account $1,498,000 $1,200,000 Average daily sales on account (sales ÷ 365) $ 4,104 $ 3,288
Accounts Receivable Analysis Number of Days’ Sales in Receivables 2006 2005 Accounts receivable (net), end of year $ 115,000 $ 120,000 Net sales on account $1,498,000 $1,200,000 Average daily sales on account (sales ÷ 365) $ 4,104 $ 3,288 Number of days’ sales in receivables 28.0 36.5 Use: To assess the efficiency in collecting receivables and in the management of credit.
Cost of goods sold Average inventory Inventory turnover = Inventory Analysis Inventory Turnover 2006 2005 Cost of goods sold $1,043,000 $ 820,000 Inventories: Beginning of year $ 283,000 $ 311,000 End of year 264,000 283,000 Total $ 547,000 $ 594,000 Average (Total ÷ 2) $ 273,500 $ 297,000
Inventory Analysis Inventory Turnover 2006 2005 Cost of goods sold $1,043,000 $ 820,000 Inventories: Beginning of year $ 283,000 $ 311,000 End of year 264,000 283,000 Total $ 547,000 $ 594,000 Average (Total ÷ 2) $ 273,500 $ 297,000 Inventory turnover 3.8 2.8 Use: To assess the efficiency in the management of inventory.
Number of Days’ Sales in Inventory Inventories, end of year Average daily cost of goods sold = Inventory Analysis Number of Days’ Sales in Inventory 2006 2005 Inventories, end of year $ 264,000 $283,000 Cost of goods sold $1,043,000 $820,000 Average daily cost of goods sold (COGS ÷ 365) $ 2,858 $ 2,247
Inventory Analysis Number of Days’ Sales in Inventory 2006 2005 Inventories, end of year $ 264,000 $283,000 Cost of goods sold $1,043,000 $820,000 Average daily cost of goods sold (COGS ÷ 365) $ 2,858 $ 2,247 Number of days’ sales in inventory 92.4 125.9 Use: To assess the efficiency in the management of inventory.
Long-Term Creditors Ratio of Fixed Assets to Long-Term Liabilities 2006 2005 Fixed assets (net) $444,500 $470,000 Long-term liabilities $100,000 $200,000 Ratio of fixed assets to long-term liabilities 4.4 2.4 Use: To indicate the margin of safety to long-term creditors.
Long-Term Creditors Ratio of Liabilities to Stockholders’ Equity 2006 2005 Total liabilities $310,000 $443,000 Total stockholders’ equity $829,500 $787,500 Ratio of liabilities to stockholders’ equity 0.37 0.56 Use: To indicate the margin of safety to creditors.
Income before income tax + interest expense Interest expense Number of Times Interest Charges Earned = Long-Term Creditors Number of Times Interest Charges Earned 2006 2005 Income before income tax $ 900,000 $ 800,000 Add interest expense 300,000 250,000 Amount available for interest $1,200,000 $1,050,000
Long-Term Creditors Number of Times Interest Charges Earned 2006 2005 Income before income tax $ 900,000 $ 800,000 Add interest expense 300,000 250,000 Amount available for interest $1,200,000 $1,050,000 Number of times earned 4.0 4.2 Use: To assess the risk to debtholders in terms of number of times interest charges were earned.
Profitability Analysis • Profitability is the ability of an entity to earn profits. • This ability to earn profits depends on the effectiveness and efficiency of operations as well as resources available. • Profitability analysisfocuses primarily on the relationship between operating results reported in the income statementand resources reported in the balance sheet.
The Common Stockholder Ratio of Net Sales to Assets 2006 2005 Net sales $1,498,000 $1,200,000 Total assets: Beginning of year $1,053,000 $1,010,000 End of year 1,044,500 1,053,000 Total $2,097,500 $2,063,000 Average (Total ÷ 2) $1,048,750 $1,031,500 Excludes long-term investments
The Common Stockholder Ratio of Net Sales to Assets 2006 2005 Net sales $1,498,000 $1,200,000 Total assets: Beginning of year $1,053,000 $1,010,000 End of year 1,044,500 1,053,000 Total $2,097,500 $2,063,000 Average (Total ÷ 2) $1,048,750 $1,031,500 Ratio of net sales to assets 1.4 1.2 Use: To assess the effectiveness of the use of assets.
The Common Stockholder Rate Earned on Total Assets 2006 2005 Net income $ 91,000 $ 76,500 Plus interest expense 6,000 12,000 Total $ 97,000 $ 88,500 Total assets: Beginning of year $1,230,500 $1,187,500 End of year 1,139,500 1,230,500 Total $2,370,000 $2,418,000 Average (Total ÷ 2) $1,185,000 $1,209,000 Rate earned on total assets 8.2% 7.3% Use: To assess the profitability of the assets.
The Common Stockholder Rate Earned on Stockholders’ Equity 2006 2005 Net income $ 91,000 $ 76,500 Stockholders’ equity: Beginning of year $ 787,500 $ 750,000 End of year 829,500 787,500 Total $1,617,000 $1,537,500 Average (Total ÷ 2) $ 808,500 $ 768,750 Rate earned on stockholders’ equity 11.3% 10.0% Use: To assess the profitability of the investment by stockholders.
11.3% 10.0% Leverage 2.7% Leverage 3.1% 7.3% 8.2% Leverage 10% 5% 0% 2006 2005 Rate earned on total assets Rate earned on stockholders’ equity
The Common Stockholder Rate Earned on Common Stockholders’ Equity 2006 2005 Net income $ 91,000 $ 76,500 Less preferred dividends 9,000 9,000 Remainder—common stock $ 82,000 $ 67,500 Common stockholders’ equity: Beginning of year $ 637,500 $ 600,000 End of year 679,500 637,500 Total $1,317,000 $1,237,500 Average (Total ÷ 2) $ 658,500 $ 618,750
The Common Stockholder Rate Earned on Common Stockholders’ Equity 2006 2005 Net income $ 91,000 $ 76,500 Less preferred dividends 9,000 9,000 Remainder—common stock $ 82,000 $ 67,500 Common stockholders’ equity: Beginning of year $ 637,500 $ 600,000 End of year 679,500 637,500 Total $1,317,000 $1,237,500 Average (Total ÷ 2) $ 658,500 $ 618,750 Rate earned on common stockholders’ equity 12.5% 10.9% Use: To assess the profitability of the investment by common stockholders.
The Common Stockholder Earnings Per Share on Common Stock 2006 2005 Net income $ 91,000 $ 76,500 Less preferred dividends 9,000 9,000 Remainder—common stock $ 82,000 $ 67,500 Shares of common stock 50,000 50,000 Earnings per share on common stock $1.64 $1.35 Use: To assess the profitability of the investment by common stockholders.
The Common Stockholder Price-Earnings Ratio 2006 2005 Market price per share of common $41.00 $27.00 Earnings per share on common ÷ 1.64 ÷ 1.35 Price-earnings ratio on common stock 25 20 Use: To indicate future earnings prospects, based on the relationship between market value of common stock and earnings.
$1.64 $1.35 $0.80 $0.60 Dividends and Earnings Per Share $2.00 $1.50 Per share $1.00 $0.50 $0.00 2006 2005 Earnings Dividends
The Common Stockholder Dividend Yield on Common Stock 2006 2005 Dividends per share of common $ 0.80 $ 0.60 Market price per share of common ÷ 41.00 ÷ 27.00 Dividend yield on common stock 1.95% 2.22% Use: To indicate the rate of return to common stockholders in terms of dividends.
Corporate Annual Reports In addition to financial statements, the annual reportincludes a management discussion analysis (MDA) and an independent auditors’ report. The MDA includes an analysis of the results of operations and discusses management’s opinion about future performance. It compares the prior year’s income statement with the current year’s. It also contains an analysis of the firm’s financial condition.
Corporate Annual Reports In addition to financial statements, the annual reportincludes a management discussion analysis (MDA) and an independent auditors’ report. Before issuing annual statements, all publicly held corporations are required to have an independent audit of their financial statements. The CPAs who conduct the audit render an opinion as to the fairness of the statements.