Measures of Central Tendency
120 likes | 853 Vues
Measures of Central Tendency. Psych 101 with Professor Michael Birnbaum. Four “Averages”. Mode: The Mode of Variable X is the value of X that is most frequent. Median: The Median of X is the value of X such that an equal number are above and below X.

Measures of Central Tendency
E N D
Presentation Transcript
Measures of Central Tendency Psych 101 with Professor Michael Birnbaum
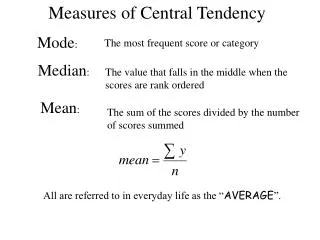
Four “Averages” • Mode: The Mode of Variable X is the value of X that is most frequent. • Median: The Median of X is the value of X such that an equal number are above and below X. • Midpoint: Value of X that is half-way between the smallest and largest value. • Mean: The Arithmetic Average (Sum of X, divided by the number).
“Averages” claims to fame: • The Mode is most often correct • The Median minimizes the sum of absolute deviations. • The Mean minimizes the sum of squared deviations (sum of squared errors). • The Midpoint minimizes the biggest deviation.
Example: Suppose we have n = 5 numbers, as follows: X1 = 10 X2 = 0 X3 = 10 X4 = 8 X5 = 9
Find the Mode: X1 = 10 X2 = 0 X3 = 10 X4 = 8 X5 = 9 The Mode is the value of X that is most frequent. There are more 10s than any other value. So, the Mode is 10.
Find the Median The Median has an equal number above and below it. Here, 9 has 2 numbers above and 2 below, so the Median is 9. X1 = 10 X2 = 0 X3 = 10 X4 = 8 X5 = 9
Find the Midpoint X1 = 10 X2 = 0 X3 = 10 X4 = 8 X5 = 9 The Midpoint is half-way Between the smallest Value of X and the largest.
Find the Mean X1 = 10 X2 = 0 X3 = 10 X4 = 8 X5 = 9
Summary of Example Mode= 10 Median = 9 Midpoint = 5 Mean = 7.4 All are “averages”
Next Idea: Variance • If we must guess, and if we are penalized by the sum of squared errors, the Mean is our best guess. • If we always guess the Mean, the cost will be minimal. • The average cost per guess is the Variance, or Mean Squared Error. • Square root of that Mean Square is the standard deviation.