Download
1 / 72
720 likes | 931 Vues
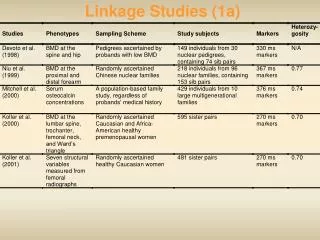
Study Design for Linkage, Association and TDT Studies. 林明薇 Ming-Wei Lin, PhD 陽明大學醫學系家庭醫學科 台北榮民總醫院教學研究部. Collins FS. (1992) Nature genetics 1:3-6. Collins FS. (1992) Nature genetics 1:3-6. Linkage Mapping for Disease Genes. Linkage analysis (Lod score method) Allele-sharing methods.

E N D
Study Design for Linkage, Association and TDT Studies 林明薇Ming-Wei Lin, PhD 陽明大學醫學系家庭醫學科 台北榮民總醫院教學研究部 YMGC Genotyping Core
Collins FS. (1992) Nature genetics 1:3-6 YMGC Genotyping Core
Collins FS. (1992) Nature genetics 1:3-6 YMGC Genotyping Core
Linkage Mapping for Disease Genes • Linkage analysis (Lod score method) • Allele-sharing methods YMGC Genotyping Core
Gregor Mendel • The principle of segregation of alleles. • The principle of independent assortment. YMGC Genotyping Core
Linkage Linkage describes the phenomenon whereby allele at neighbouring loci are close to one another on the same chromosome, they will be transmitted together more frequently than chance. YMGC Genotyping Core
Linkage Family YMGC Genotyping Core
Recombinant Gametes Crossing over between two neighbouring loci will produce recombinant gametes. YMGC Genotyping Core
Recombination Fraction Recombination fraction (θ) = number of recombinant gametes ---------------------------------------total gametes YMGC Genotyping Core
Recombination Fraction • Recombination fraction is a measure of genetic distance. • 1cM= 1% chance of recombination between two loci. YMGC Genotyping Core
Estimation of Recombination Fraction • Direct Method: count recombinants. • Maximum Likelihood Method: Unknown phases Incomplete penetrance Heterogeneity YMGC Genotyping Core
Likelihood Odds Likelihood of data if loci linked at θ Likelihood odds = Likelihood of data if loci unlinked L(θ< 0.5) = L(θ= 0.5) YMGC Genotyping Core
Lod Score L(θ< 0.5) Lod score (θ) = log10 L(θ = 0.5) YMGC Genotyping Core
Phase Known Family D d A F D d A B R N N N N N YMGC Genotyping Core
Phase Known L(θ) = (θ)r (1-θ) n-r r: No. of recombinants n: All meiosis YMGC Genotyping Core
Lod ScorePhase Known L(θ) LOD = log L(θ= 0.5) (θ) r (1-θ) n-r = log [ ] (0.5) n = log 2nθr(1-θ)n-r YMGC Genotyping Core
Phase Unknown Family D D or A B D D d d or B A B A N R A: N N N N R R N R R R B: YMGC Genotyping Core
Phase Unknown L(θ) = 1/2 (θ)r (1-θ)n-r +1/2 (θ)n-r(1-θ)r r: No. of recombinants n: All meiosis YMGC Genotyping Core
Lod ScorePhase Unknown L(θ) LOD = log L(θ= 0.5) 1/2[(θ) r(1-θ) n-r+(θ)n-r(1-θ)r ] =log { } (0.5) n = log {2n-1[θr(1-θ)n-r +θn-r(1-θ)r ]} YMGC Genotyping Core
Lod Score - Maximum Likelihood Estimate (Z) • Can be calculated at any values of between 0 and 0.5, but are conventionally reported at =0, 0.01, 0.05, 0.1, 0.2, 0.3, and 0.4. • Zmax is the maximum likelihood estimate (MLE) of . YMGC Genotyping Core
Total Lod Score Lod score obtained from individual families can be added together to calculate the total lod score. YMGC Genotyping Core
Statistical Significance of the Lod Score lod score > 3: evidence of linkage 2 < lod score < 3: suggestive evidence of linkage -2 < lod score < 2: uninformative of linkage lod score < -2: exclusion of linkage YMGC Genotyping Core
Lod Score • Two-point lod score analysis • Multipoint lod score analysis YMGC Genotyping Core
Is a Pedigree Useful for linkage Analysis? • Are critical individuals in the pedigrees doubly heterozygous at the loci? (Informative) • Can the offsprings be scored as recombinants or nonrecombinants? (Phase) YMGC Genotyping Core
Parameters Assumed in Lod Score Analysis • Transmission mode of disease • Recombination fraction • Trait allele frequencies • Penetrance values for each possible disease phenotypes • Marker allele frequencies. YMGC Genotyping Core
Advantages of Lod Score Analysis • Statistically, it is more powerful approach than any nonparametric method. • Utilizes every family member’s phenotypic and genotypic information. • Provides an estimate of the recombination fraction. • Provides a statistical test for linkage and for genetic (locus) heterogeneity. YMGC Genotyping Core
Limitations of Lod Score Method • assumes single locus inheritance • requires specification of disease gene frequency and penetrance • has reduced power when disease model is grossly misspecified YMGC Genotyping Core
Successful Examples Using Lod Score Method • Cystic fibrosis • CFTR gene • Huntington disease • HD gene • Alzheimer disease • APP • Hereditary breast cancer • BRCA1 • BRCA2 YMGC Genotyping Core
Complex Diseases • No clear pattern of Mendelian inheritance • A mix of genetic and environmental factors • Incomplete penetrance • Phenocopies • Oligogenic or polygenic • Heterogeneity • High frequency of disease-causing allele YMGC Genotyping Core
Recurrence Risk Ratio (λ) Frequency in relatives of affected person λr = ------------------------------------------------------- Population frequency r denotes the degree of relationship YMGC Genotyping Core
Recurrence Risk Ratio Genetic mapping is much easier for traits with high λs (λs > 10) than for those with low λs (λs < 2). YMGC Genotyping Core
Recurrence Risk Ratio of Different Diseases YMGC Genotyping Core
Allele-sharing Methods • Identical by state (I.B.S.) Two alleles of the same form. • Identical by descent (I.B.D.) Two alleles are descended from the same ancestral allele. YMGC Genotyping Core
Allele-sharing Methods Testing whether affected relatives inherited a region IBD (or IBS) more often than expected under random Mendelian segregation. YMGC Genotyping Core
AC AB AC BC AB CD BC BC AC AB AD BC IBD = 0 IBD = 2 IBD = 1 YMGC Genotyping Core
BC BC AB AD BC AC IBS = 0 IBS = 2 IBS = 1 YMGC Genotyping Core
Affected Sib-pair Methods An affected sib-pair may share 0,1, 2 alleles identical by descent (IBD) with probabilities of 0.25, 0.5, 0.25, respectively, at any marker locus. YMGC Genotyping Core
AB AC IBD = 2 BC BC 25% BC AB IBD = 1 50% AC IBD = 0 25% BC AA YMGC Genotyping Core
Affected Sib-pair Methods If the marker locus is independent of the trait locus, the probabilities of the affected sib-pairs share 0,1, 2 alleles ibd will remain as 0.25, 0.50, 0.25. YMGC Genotyping Core
Affected Sib-pair Methods If the marker locus is linked to the trait locus, an excess of affected sib-pair sharing two alleles ibd will be expected. YMGC Genotyping Core
Allele-sharing Methods • Affected Sib-pairs • Affected Pedigree Member YMGC Genotyping Core
Pearson 2 statistics Comparing observed numbers of sib-pairs sharing 0, 1, 2 alleles IBD with their expectations under the null hypothesis. YMGC Genotyping Core
Pearson 2 statistics • Alternative hypothesis: IBD sharing 0 1 2 observed n0 n1 n2N = n0 + n1 + n2 • Null hypothesis:IBD sharing: 0 1 2 expected N/4 N/2 N/4 YMGC Genotyping Core
Comments on Allele-Sharing Method • There is no need to specify any genetic parameters of the transmission model. • Less powerful to detect linkage compared with the lod score method if the genetic transmission model can be specified correctly. • It is poor at providing a precise location of the disease gene. YMGC Genotyping Core
Successful Examples Using Sib Pair Method • Insulin-dependent diabetes • Non-insulin-dependent diabetes • Multiple sclerosis • Alzheimer disease YMGC Genotyping Core
Thresholds for Mapping Complex Traits YMGC Genotyping Core