Download
1 / 8
80 likes | 462 Vues
FIGURE 15-1 Actual and PPP Exchange Rate of the Dollar, 1973-1999. Salvatore: International Economics, 7th Edition © 2001, John Wiley & Sons, Inc. FIGURE 15-2 Relative Money Supplies and Exchange Rates. Salvatore: International Economics, 7th Edition © 2001, John Wiley & Sons, Inc.

E N D
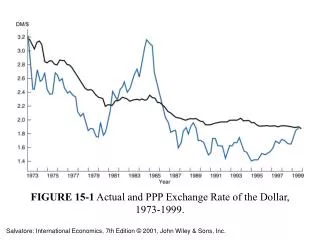
FIGURE 15-1 Actual and PPP Exchange Rate of the Dollar, 1973-1999. Salvatore: International Economics, 7th Edition © 2001, John Wiley & Sons, Inc.
FIGURE 15-2 Relative Money Supplies and Exchange Rates. Salvatore: International Economics, 7th Edition © 2001, John Wiley & Sons, Inc.
FIGURE 15-3 Nominal and Real Exchange Rate Indices Between the Dollar and the Mark, 1973-1999. Salvatore: International Economics, 7th Edition © 2001, John Wiley & Sons, Inc.
FIGURE 15-4 Nominal Interest Rate Differentials and Exchange Rate Movements, 1973-1999. Salvatore: International Economics, 7th Edition © 2001, John Wiley & Sons, Inc.
FIGURE 15-5 Exchange Rate Overshooting. Salvatore: International Economics, 7th Edition © 2001, John Wiley & Sons, Inc.
(Figure continues on next slide) FIGURE 15-6 Overshooting of Dollar Exchange Rates. Salvatore: International Economics, 7th Edition © 2001, John Wiley & Sons, Inc.
FIGURE 15-6 (continued) Salvatore: International Economics, 7th Edition © 2001, John Wiley & Sons, Inc.
FIGURE 15-7 The Euro/Dollar Exchange Rate in 1999. Salvatore: International Economics, 7th Edition © 2001, John Wiley & Sons, Inc.