Download
1 / 27
270 likes | 476 Vues
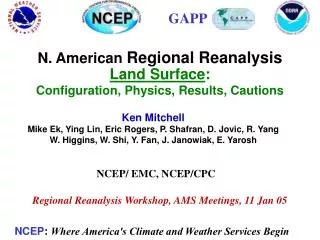
GAPP. N. American Regional Reanalysis Land Surface : Configuration, Physics, Results, Cautions. Ken Mitchell Mike Ek, Ying Lin, Eric Rogers, P. Shafran, D. Jovic, R. Yang W. Higgins, W. Shi, Y. Fan, J. Janowiak, E. Yarosh. NCEP/ EMC, NCEP/CPC.

E N D
GAPP N. American Regional Reanalysis Land Surface: Configuration, Physics, Results, Cautions Ken Mitchell Mike Ek, Ying Lin, Eric Rogers, P. Shafran, D. Jovic, R. Yang W. Higgins, W. Shi, Y. Fan, J. Janowiak, E. Yarosh NCEP/ EMC, NCEP/CPC Regional Reanalysis Workshop, AMS Meetings, 11 Jan 05 NCEP: Where America's Climate and Weather Services Begin
Land Modeling Support at NCEP • NOAA Office of Global Programs (OGP) • GAPP: GEWEX America Prediction Project • GCIP: GEWEX Continental International Project • These OGP programs are major sponsors of advancements in land surface modeling and land data assimilation in NCEP’s Environmental Modeling Center (EMC)
The N. American Regional Reanalysis:A Coupled Atmosphere-Land System with hourly assimilation of observed precipitation Pre-forecast data assimilation period Free forecast period In the forecast period between the analysis steps of the 12h pre-forecast data assimilation period, at each time step and at each point where observed precipitation is available, we compare Pmod to Pobs, then modify the model’s temperature, moisture, cloud and rain field to be more consistent with observed precipitation. See NARR Article in May 2004 issue of GEWEX/NEWS
Noah Land Surface Model in NARR • 4 soil layers: 10, 30, 60, 100 cm • -- total soil moisture • -- liquid soil moisture • -- soil temperature • cold season processes(Koren et al 1999) • -- snowpack --- snow water equivalent (SWE) --- snow depth (i.e. snow density) • -- frozen soil freeze/thaw physics • - surface evaporation components • -- Et: transpiration through plant canopy • --- Jarvis treatment of canopy resistance • -- Ed: direct soil evaporation • -- Ec: canopy evaporation • --- dew/frost, intercepted precipitation • -- Es: snow sublimation • Vegetation phenology from NESDIS • -- based on AVHRR NDVI • -- fraction of green vegetation cover • -- monthly global 0.144-deg 5-year climatology • -- derived by Gutmann and Ignatov 1998)
GREEN VEGETATION FRACTION PHENOLOGY: via NESDIS/ORA based on NDVI from AVHRR From global, monthly 0.144 degree green vegetation fraction database (Gutman and Ignatov, 1998). Monthly values are interpolated to daily values in the NARR.
Example NARR Cold Season States: 01 Jan 92, 21Z Snow depth (cm) Shown later: Daily update increment of snowpack state from U.S. Air Force analysis must be included in land surface water budget.
Chen et al. (1996, JGR, GCIP Special Issue 1) Canopy resistance and soil hydraulics/thermodynamics Koren et al. (1999, JGR, GCIP Special Issue 2) Snowpack and frozen soil physics Ek et al. (2003, JGR, GCIP Special Issue 3) Improvements to subsurface heat fluxes under snow and vegetation Berbery et al. (2003, JGR, GCIP Special Issue 3) Ops Eta model Mississippi land surface water and energy budget Mitchell et al. (2004, JGR) Evaluation in uncoupled N. American LDAS (NLDAS) Also see various PILPS and GSWP papers Uncoupled Noah LSM performance Key references for Noah LSM physics & performance
Land Surface Subset of NARR output • NARR Land-surface subset: – 720 Gb / 25-year • 75 Mb/day tar file of Land A, B, C files • versus 450 Mb/day for primary output • via NCEP NOMADS server (free anonymous access) • Land A files: surface forcing (155 Gb for 25-years) -- can drive offline LSMs • Land B files: includes prognostic land states (soil moisture/temp., snow) • Land C files: includes surface water and energy fluxes • from which to calculate land surface water and energy budgets • 3-hour accumulated water fluxes (mm) • 3-hour averaged energy fluxes (watts/m**2) • Also need Merged B file to: • calculate daily snow update increment in surface water budget • obtain instantaneous surface energy fluxes (vs. 3-hr mean in Land C file) • Fixed field file (18 fields, veg and soil type, land mask, etc) • Soil and veg parameter fields (soil porosity, wilting point, min stomatal resistance)
18 NARR Fixed Fields • Examples: • Terrain height • Land mask • Latitude • Longitude • Soil type (Zobler classes: 7 classes) • Vegetation type (SiB classes: 12) • Number of soil layers in root zone • Maximum albedo over deep snow • Wilting point • Soil porosity • Minimal stomatal resistance
Example Fixed Fields Maximum albedo over deep snow Vegetation Class: 12 Sib classes
Hourly output at over 1300 sites:(especially convenient in 72-hour free forecasts) Examples shown here: • Atmospheric sounding • Near surface forcing • Land surface fluxes • -- latent & sensible heat flux
NARR Land Surface Examples: Drought of 1988 vs. Flood of 1993
Difference of 1993 minus 1988 June + July Mean Precipitation
NARR: Soil moisture availability (percent of saturation) Top 1-meter of soil column 1993 1988 Average during 16-31 July(at 21 GMT)
NARR: Atmospheric Boundary Layer Depth (m) 1993 1988 Average during 16-31 July(at 21 GMT)
NARR Annual Mean Fields (1998-2002)(to compare with ops EDAS in Berbery et al., 2003, JGR)
Ops 12-km EDAS 2004 mean July 18Z-21Z average latent heat flux(sign convention: negative values are upward flux from surface, i.e. surface energy sink) 32-k Regional Reanalysis Global Reanalysis 1 NLDAS
Observed Latent Heat Flux (LH): 3 stations( Tilden Meyers: NOAA/ARL, eddy correlation stations )(Brotzge and Crawford, JHM, 2003: such stations give 20% low bias summer LH)
NARR Summer Latent Heat Flux in eastern half of CONUS appears to have modest high bias • Hypothesis as to why: Ops EDAS legacy in NARR • Ops EDAS has low precipitation forcing bias • Ops EDAS assimilates radar dominated precip estimates • Radar-dominated precip estimates have low bias over summer CONUS • Above ops EDAS precip forcing bias tends to yield dry soil moisture bias in Ops EDAS • Ops Eta model canopy resistance was tuned to lower values to maintain reasonable evaporation rates given low soil moisture bias • Ops Eta model canopy resistance was not re-tuned to higher values for Regional Reanalysis, which has less low bias in its precipitation forcing, which is anchored to a daily gauge analysis
Example of low precipitation bias in ops EDAS:Observed (Higgins/Shi CPC) minus ops EDASprecipitation total (mm) for August 2003
High bias in NARR eastern-CONUS warm season evaporation overly depletes soil moisture over Illinois Obs: solid black NLDAS: dashed green NARR: dashed black Courtesy: Y. Fan & H. Van den Dool
NARR Monthly Water Budget: 1998-2002 Mississippi Basin(compare with ops EDAS by Berbery et al. (2003, JGR) (ops Eta min)
NARR Monthly Water Budget: 1998-2002 Mississippi Basin(compare with ops EDAS by Berbery et al. (2003, JGR) Black: no snow update Green: with snow update
Must include daily NARR snowpack update in the NARR land surface water budgetAt 00Z each day, NARR snowpack depth is updated from external daily Air Force snowdepth analysis 00Z NARR Anal SWE (mm) 21Z NARR Anal –Ges SWE (mm) is zero 00Z NARR Anal –Ges SWE (mm) is nonzero 03Z NARR Anal –Ges SWE (mm) is zero
Snowpack physics in Noah LSM Version 2.6 in NARR has systematic tendency to melt snowpack too early • This systematic behavior was solved in Noah Versions 2.7 and higher, but not in time to make it into the production NARR (despite concerted attention to this problem) • Hence daily snowpack increment will tend to be positive (increase snowpack SWE) • Acts as a source of water mass to land water budget • Above two factors will likely yield a high bias in season-total snowmelt
NARR Verification: Near Surface Meteorology • Compared to Global Reanalysis: • NARR has smaller 2-m temperature bias and rms error in both winter and summer • NARR has less diurnal cycle error
January 1998 2-m Temperature 1st Guess July 1998 RMS RMS Bias Bias