Download
1 / 15
150 likes | 273 Vues
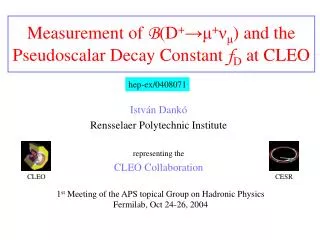
Measurement of B (D + → μ + ν μ ) and the Pseudoscalar Decay Constant f D at CLEO. hep-ex/0408071. Istv á n Dankó Rensselaer Polytechnic Institute representing the CLEO Collaboration. CLEO. CESR. 1 st Meeting of the APS topical Group on Hadronic Physics Fermilab, Oct 24-26, 2004.

E N D
Measurement of B(D+→μ+νμ) and the Pseudoscalar Decay Constant fD at CLEO hep-ex/0408071 István Dankó Rensselaer Polytechnic Institute representing the CLEO Collaboration CLEO CESR 1st Meeting of the APS topical Group on Hadronic Physics Fermilab, Oct 24-26, 2004
Outline • Motivation • Detector and data sample • Analysis strategy: • tagging technique • signal selection • Background • Summary
Motivation Helicity suppression: τ : μ : e = 3.2 : 1 : 2.4x10⁻⁵ Pseudoscalar Decay Constant • Direct Measurement of fD . • Establish the accuracy of potential models and Lattice QCD computations in heavy quark sector. • Charm measurements can be used to determine fB which is important to determine CKM matrix elements. For example: precise CLEO-c fD measurement + LQCD fB/fD could give a ~1% prediction for fB
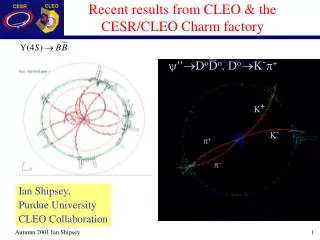
The CLEO-c detector • SVX → 6-layer inner drift chamber. • 1.5 T → 1T B field. Ψ(2S) Ψ(3770) Data sample: ~60 pb-1 on the ψ(3770). GeV Ecm
Analysis strategy e+ e-(3770)(1--) D– Signal Side D+ m-nμ K-p+ p+ K-p+ p+ p0 Tagged Side Ks p+ p0 (fully reconstructed D) Ks p+ Ks p+ p- p+ + CC Event ~35%
K-p+ p+p0 K-p+ p+ Ks p+ p- p+ Ks p+ Ks p+ p0 Charged D-tag Reconstruction Preliminary! • Two key variables: |E| < 20 MeV Extract the number of tags from fit to the Mbc distribution: 28574 ± 207 ± 629 ±2.2% systematic uncertainty from varying the background shape (Argus vs. polynomial)
Signal Extraction • Find events with an additional single track (beside the tagged D+): • No extra tracks or reconstructed Ks (→π+π–). • Largest extra shower < 250 MeV. • Calculate MM2to separate signal from background: • Signal peaks at MM2 = 0 (neutrino mass) • Account for the background in the signal region of MM2(see later).
Muon candidate selection DATA 98.7 0.2% • Polar angle: |Cos(θ)| < 0.81 good resolution helps to suppress D–→π–π0 bckg. • Consistent with minimum ionizing particle: deposited energy in CC < 300 MeV • Use e+e–→μ+μ– sample to study signature of muons. • Not consistent with K (based on RICH info). MC
Extra tracks and showers • Use double tag D0 data sample to study extra particles and showers in the detector. 93.5 0.9% • No extra good tracks coming from the IP. • Max Extra Shower energy < 250 MeV • Helps to reject D–→π–π0 background
(Missing Mass)2 D– -> Ksp- • Use only direction of the reconstructed D s=0.024±0.002 • Correct for non-zero crossing angle • between e+e– beams • (boost to CM frame). s=0.021±0.001 • Use tagged D–→Ksπ– sample to check • data and MC consistency. Increase MM2 width from MC by 14% to 0.028 GeV2.
DATA K0p- Preliminary! ~60 pb-1 Signal region MM2 Distribution
Backgrounds Estimated backgrounds from MC: • D Background: • D+ p+p0 • D+ K0p+ • D+ t+ n , t + p+ n • D+ p0 m+ n • D0D0 Background: • D0D0 can look like D+D–: e.g.:D0K-p+, D0p+m-n • ContinuumBackground Assign 100% systematic uncertainty to background.
Signal Preliminary! ~60 pb-1 CLEOc DATA • 8 events within ±2σ (–0.056<MM2<0.056 GeV2) • 1.07 1.07 estimated background events. • Reconstruction efficiency: 69.9 % GeV2 MM2 Fractional systematic errors on B: a) m detection e (5%) b) background, taken as 100% uncertainty (15.4%) c) tagged sample size (2.2%) B = (3.51.40.6 )10-4 fD = (201 41 17) MeV Preliminary!
Measurements vs. Predictions • BES • Lattice 2004 • CLEO-c • Isospin Mass Splittings • Potential Model • Rel. Quark Model • QCD Sum Rules • QCD Spectral Sum Rules • MILC • UKQCD Experimental uncertainty is not small enough yet to constrain theory.
Summary • We report the first statistically compelling evidence for the decay D+→μ+ν . • The measured branching fraction B (D–m–n) =(3.51.4 0.6) x10-4 • and D meson decay constant fD= (201 41 17) MeV • Preliminary results presented at ICHEP 04 (hep/ex-0408071). • To be submitted to PRD. • Continuing work to get more data. Preliminary!