Download

1 / 22
220 likes | 350 Vues
This paper presents an in-depth review of geo-neutrinos, their implications for understanding Earth's interior, and the challenges posed by natural radioactivity. We discuss the development of a refined reference model based on findings from experiments at KamLAND and ongoing studies at Borexino in Central Italy. Key topics include the distribution of U and Th, the contributions to terrestrial heat production, and the consistency of geo-neutrino signals with geochemical models. This work aims to enhance our understanding of geoneutrino data and its implications for Earth's composition and thermal history.

E N D
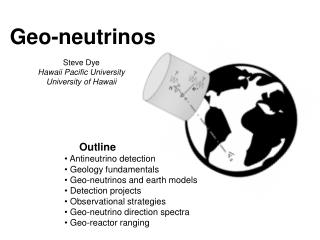
Neutrino Champagne LowNu 2009 Fabio Mantovani INFN - Ferrara Towards a Refined Reference Model for Geo-neutrinos Bonadiman C., Boraso R., Coltorti M., Di Carlo G., Ferrari N., Fiorentini G., Ianni A., Mantovani F., Mariani S., Morsilli M., Nisi S., Ricci B.,Riva A., Rusciadelli G., Tassinari R., Tomei C.
Summary • Overview on geo-neutrinos • Open questions about radioactivity in the Earth • The Reference Model • A Refined Reference Model for Geo-neutrinos • A case study: KamLAND and the Japan Arc • A study in progress: Borexino and the Central Italy • Conclusions and perspectives arXiv:0707.3203
Geo-neutrinos: anti-neutrinos from the Earth • Earth emits (mainly) antineutrinos whereas Sun shines in neutrinos. • A fraction of geo-neutrinos from U and Th (not from 40K) are above threshold for inverse b on protons: • Different components can be distinguished due to different energy spectra: e. g. anti-n with highest energy are from Uranium. U, Th and 40K in the Earth release heat together with anti-neutrinos, in a well fixed ratio:
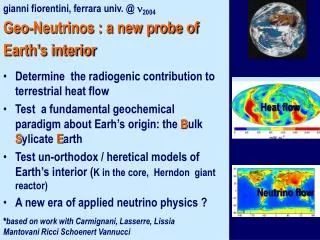
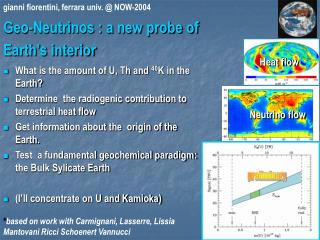
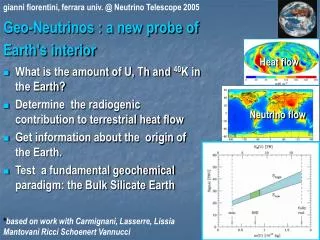
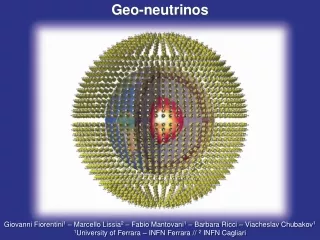
Probes of the Earth’s interior Geo-neutrinos: a new probe of Earth's interior • They escape freely and instantaneously from Earth’s interior. • They bring to Earth’s surface information about the chemical composition of the whole planet. Araki et al., 2005, Nature • Deepest hole is about 12 km • Samples from the crust (and the upper portion of mantle) are available for geochemical analysis. • Seismology reconstructs density profile (not composition) throughout all Earth.
Open questions about natural radioactivity in the Earth 2 - How much U and Th in the crust? 3 - How much U and Th in the mantle? 1 - What is the radiogenic contribution to terrestrial heat production? 4 - What is hidden in the Earth’s core? (geo-reactor,40K, …) Next talk by Maricic 5 - Is the standard geochemical model (BSE) consistent with geo-neutrino data?
The World Wide Reference Model* Geo-n signals from U and Th over the globe have been calculated by using: • A 2°x2° crustal model (Laske G. – 2001). • For each of the 16200 tiles density and thickness of sediments, upper, middle and lower crust are given. • Values of the U and Th mass abundance in each layer taken as mean values of GERM data. • Spread of GERM data used as indication of uncertainties. • Mantle is divided into two spherically symmetrical reservoirs (UM and LM). • For UM measured abundances were used • For LM the abundances were deduced from BSE mass balance • No U and Th in the core * F. Mantovani et al. – Phys. Rev. D 69 – 2004 - hep-ph/0309013
Geo-n: predictions of the BSE Reference Model • 1 TNU = one event per 1032 free protons per year • All calculations in agreement to the 10% level • Different locations are sensitive to the contributions of radioactivity from crust and from mantle
Taup 2007 KamLAND 2002-2007 results on geo-neutrino • In five years data ~ 630 counts in the geo-n energy range: • ~ 340 reactors antineutrinos • ~ 160 fake geo-n, from 13C(a,n) • ~ 60 random coincidences ~ 70 Geo-neutrino events are obtained from subtraction. Adding the “Chondiritic hypoythesis” for Th/U: N (U+Th) = 75 ± 27 S(U+Th) = 39 ± 14 TNU* This pioneering experiment has shown that the technique for identifying geo-neutrinos is now available!!! * I. Shimizu (KamLAND), TAUP 2007.
The Reference Model for Kamioka • Our* world wide reference model (16200 2°x2° tiles) predicts for KamLAND: • The contribution of the 6 tiles near Kamioka was found by us as: The regional contribution has to be controlled/determined by study of regional geology, if one wants to extract the global information brought in by geo-n’s * F. Mantovani et al. – Phys. Rev. D 69 – 2004 - hep-ph/0309013
Refining the Reference Model for KamLAND* • Use a geochemical study of the Japan Arc exposed upper crust (166 samples distinguishing 10 geological classes) • Use detailed (± 1 km) measurements of Conrad and Moho depth • Use selected values for abundances LC • Build a new crustal map of the Japan Arc (scale ¼° x ¼°) • Consider possible effect of the subducting platebelow Japan Kamioka • Take into account several sources of uncertainties: • (3s) errors on sample activity measurements • Finite resolution of geochemical study • Uncertainty from the Japan sea crust characterization • Uncertainty from subducting plates below Japan • Uncertainty of seismic measurements * G. Fiorentini et al. – Physical Review D72 – 2005 – arXiv:hep-ph/0501111
Refining the Reference Model for KamLAND • By adding the different contributions and summing in quadrature independent uncertainties: In good agreement with the estimate of the rough 2°x2° calculation (17.6 TNU). *Full range or 3 sigma uncertainties
The Reference Model for Gran Sasso • Our world wide reference model (16200 2°x2° tiles) predicts for Borexino: • The contribution of the 6 tiles near Borexino was found by us (Ref. Mod.) as: • A 2°x2° tile centered at Gran Sasso gives: Can we provide a more precise assessment of this regional contribution?
3D model of the central tile • INPUT • Data of CROP seismic sections • Data from 38 deep oil and gas wells • IDENTIFY SIX RESERVOIRS • Cenozoic terrigenous units • Meso-Cenozoic Basinal Carbonate units • Mesozoic Carbonate units • Permian and Paleozoic clastic units • Upper crust • Lower crust • OUTPUT A 3D dimensional model, built on 106 1 km3 cells
Extension of the different reservoirs in the vertical profile Compare the average thickness of different reservoirs… Ref. model 3D model Note the different proportions, although the total depth is practically the same.
The sedimentary cover of the central tile • We collected representative samples of the sedimentary cover and measured U and Th content by using ICP-MS: • By using these abundances and the 3D model, the estimated signal from the sedimentary cover is: Preliminary • To be compared with that estimated in Ref. Mod.: • (remind the 0.5 km sediment layer) * Standard deviation of measured samples
The crust composition of the CT • We collected representative samples from outcropping Adriatic Crust on Western Alps. • We measured U and Th content by using ICP-MS • To fix the relative amounts of acid and mafic rocks in the UC we used seismic arguments, increasing the fraction of mafic rock with depth (LC): • By using the 3D model, we estimates the total signal from the crust of the central tile: • To be compared with that estimated in Ref. Model: Preliminary Preliminary
The total signal from the central tile The total geo-neutrino signal from the central tile at Gran Sasso: Preliminary • Note that: • The increased contribution from the sediment is mainly originated by different vertical profile of the reservoirs • The adopted U and Th abundance and the reduced total volume decrease the total signal from the crust
The rest of the regional contribution • We consider the region out of the central tile and refine the model by using: • Data of the main CROP seismic sections • Depth conversion velocities of the crustal stratigraphic layers • Detailed measurements of Moho depth By using the deduced U and Th abundance, the signal from the refined out-region is: Preliminary To be compared with that estimated in Ref.:
Conclusions We can estimate the expected geoneutrinos signal at LNGS: Preliminary Preliminary The signal is to be compared with that estimated in Ref. Mod.: For 80% eff. and 300 tons C9H12 fiducial mass, we expect ~ 5.5 events/year at LNGS. Preliminary
The picture is not completed yet… The contributing uncertainties… • For the regional contribution to thesignal, uncertainties arise from: • Variations within measured samples • Measurement methods (ICMS – Gamma spectroscopy) • Mixture felsic/mafic rocks in the UC and LC • Time-Depth conversion of velocities of the crustal layers • Matching between the types of rocks and observed vp data • …