Download
1 / 31
320 likes | 586 Vues
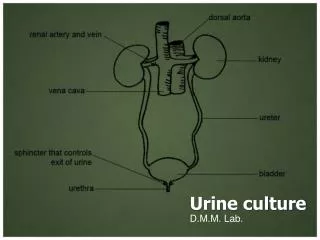
Analysis and identification of abnormal metabolites in urine using : Chromatography. Paper and Thin layer Chromatography. Objective:. 1- To analyse and identify different amino acids (abnormal metabolites in urine) by paper and TL chromatography.

E N D
Analysis and identification of abnormal metabolites in urine using: Chromatography Paper and Thin layer Chromatography
Objective: 1- To analyse and identify different amino acids (abnormal metabolites in urine) by paper and TL chromatography. 2- to study the difference between paper and TLC
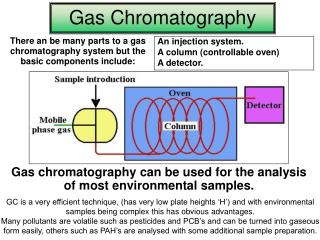
Chromatography • Chromatography is a method of separating a mixture of molecules depending on their distribution between a mobile phase and a stationary phase. • The mobile phase (also known as solvent) may be either liquid or gas. • The stationary phase (also known as sorbent) can be either a solid or liquid, a liquid stationary phase is held stationary by a solid. • The solid holding the liquid stationary phase is the support or matrix.
Cont… • The molecules in the mixture to be separated are the solutes.
Types of chromatography • Partition chromatography • Adsorption chromatography • Gel filtration • Ion exchange chromatography
Partition chromatography • The distribution of solutes between two immiscible phases. • The solute will distribute it self between the two phases according to its solubility in each phase, this is called partitioning.
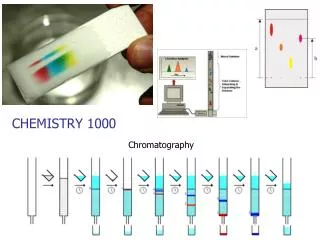
Examples of partition chromatography • The two most common types of partition chromatography are thin layer chromatography and paper chromatography. • In both cases the stationary phase is a liquid bound to a matrix. • In paper chromatography the stationary phase are water molecules bound to a cellulose matrix.
Cont… • In TLC, the stationary phase is the solvent added to the support to form the thin layer so the solvent gets bound to the matrix (support). • Partition chromatography is mainly used for separation of molecules of small molecular weight.
Paper chromatography • The cellulose support contains a large amount of bound water. • Partitioning occurs between the bound water which is the stationary phase and the solvent which is the mobile phase.
Experimental procedure for paper chromatography • A small volume of a solution of a mixture to be separated or identified is placed at a marked spot (origin) on a sheet or strip of paper and allowed to dry. • The paper is then placed in a closed chamber and one end is immersed in a suitable solvent. • The solvent is drawn (moved) through the paper by capillary action.
Cont… • As the solvent passes the origin, it dissolves the sample and moves the components in the direction of flow. • After the solvent front has reached a point near the other end of the paper, the sheet or strip is removed and dried. • The spots are then detected and their positions marked.
Cont.. • The ratio of the distance moved by a solute to the distance moved by the solvent = Rf. • The Rf. is always less than one.
chromatogram • Once a sample is applied on TLC or paper, it’s called chromatogram. • Paper chromatogram can be developed either by ascending or descending solvent flow. • Descending chromatography is faster because gravity helps the solvent flow. • Disadvantages : it’s difficult to set the apparatus. • Ascending is simple and inexpensive compared with descending and usually gives more uniform migration with less diffusion of the sample "spots".
Detection of spots • Spots in paper chromatograms can be detected in 4 different ways: • By their natural color • By their fluorescence • By their chemical reactions that take place after the paper has been sprayed with various reagents for example: during paper chromatography of amino acids, the chromatograms are sprayed with ninhydrin. • By radioactivity
Identification of spots • The spots are usually identified by comparing of standards of known Rf values.
Thin layer chromatography • Paper chromatography uses paper which can be prepared from cellulose products only. • In TLC, any substance that can be finely divided and formed into a uniform layer can be used. • Both organic and inorganic substances can be used to form a uniform layer for TLC. • Organic substances include: cellulose, polyamide, polyethylene • Inorganic: silica gel, aluminum oxide and magnesium silicate
TLC • The stationary phase is the solvent used to form a layer of sorbent spread uniformly over the surface of a glass or plastic plate
Advantages of TLC over paper chromatography • Greater resolving power because there is less diffusion of spots. • Greater speed of separation • Wide choice of materials as sorbents
The separation of compounds by chromatography depends on several factors: • Partition of a solute between a moving solvent phase and a stationary aqueous phase. The solute moves in the direction of a solvent flow at a rate determined by the solubility of the solute in the moving phase. Thus a compound with high mobility is more attracted to the moving organic phase than to the stationary phase.
Cont.. • Ion exchange effect: any ionized impurities in the support medium will tend to bind or attract oppositely charged ions (solutes) and will therefore reduce the mobility of these solutes. • Temperature: Since temperature can effect the solubility of the solute in a given solvent temperature is also an important factor.
Cont.. • The molecular weight of a solute also affects the solubility and hence chromatographic performance. • Adsorption of compound (solute) onto support medium: Although the support medium(silica gel) is theoretically inert, this isn't always the case. If a solute tends to bind to the support medium this will slow down its mobility in the solvent system.
Cont.. • The composition of the solvent: since some compounds are more soluble in one solvent than in the other, the mixture of solvents used will affect the separation of compounds.
Expression of the results • The term "Rf" (relative flow) is used to express the performance of a solute in a given solvent system /support medium. The term Rf value may be defined as the ratio of the distance the compound migrates to the distance the solvent migrates. Rf value is constant for a particular compound, solvent system and insoluble matrix. Rf= Distance of migration of solute Distance moved by solvent
In this Experiment: • You will examin two urine samples, one of them is normal and the second one refer to a pateint suffering from an inborn metabolism. ( patient with either phenylketonuria or cystinuria) using two standared solutions A1( L-Pha.) and A2 (L- Cys.) • In a number of inborn metabolic disorders the concentration of som amino acids may be high in the plasma or urine or both. These are often caused by genetically controlled deficiencies in certain enzymes concerned with the metabolism of those particular amino acids. This is examplified by phenylketonuria or PKU which was the first genetic defects of metabolism recognised in human.
Material and apparatus. 1- Equipment for paper an TL chromatography. TLC : Thin layer plate of silica gel ( prepared aslurry of silica gel G in 0.02 M sodiume acetate and pour it onto the plate evenly. Dry the plate and activate it before use by heating at 105 o`C for 30 minutes.) PC : Whatman No.1 chromatography paper. 2- Chromatography solvent ( Butanol : acetic acid: water, 60:15:25 by volume) 3- Standared solutions ( prepared small volumes of 1% solutions of phenylalanine and cystine). 3- Urine samples A1 and A2. ( which are diluted 1 to 10 with dis.H2O) 4- Ninhydrin ( dissolve 0.2 gm in 100 ml of acetone just befor use) 5- Oven at 105 o`C.
Method: 1- You are provided with two samples of diluted urine (1-10) from apatients with phenylketonuria or cystinuria (U1 and U2), and two standard solutions A1(L- phenylalanine solution) and A2 (L-cystine solution) 2- Take a sheet of paper or TL chromatography and draw a pencil line about 3 cm from the end. 3- Determine 4 separate points as possiple you can with pencil, and label it from the right as following:Cys. , Phy. , U1, U2.
4- Mix very well each solution and Put a one small drop from each to its points, let it to dry and repeat the drops to be concentrate it. 5- After you finish, let it to dry in a current of air for a moment. Then insert the TLC slide and the Paper C. sheet (the Chromatograms ) in the solvent inside the tank, be shore from the samples line to be up to the solvent surface ( not in touch), if it inserted inside the solvent it will not separated in right way, so you have to repeated. 6- Cover the tank with aluminum foil and glass cover, and let it to stand form 30 – 45 minutes.
7- Remove the Chromatograms from the solvent tank and directly mark the position of solvent with pencil line, and allow to dry in the current air ( if it possible in hot air). 8- Apply (spry) ninhydrin in acetone to the dry chromatograms completely. ( care should be taken in handling ninhydrin solution as it is carcinogenic) 9- Put the chromatograms in an oven ( 105 oC), until the amino acid colure spots are develop. 10- Mark the spots with a pencil(in the middle of spots) soon after development asthe colors gradually fade.
Results: Describe the chromatograms by filling the following. Calculate the Rf value for each spot and under ‘comments’ state the approximate size and color of each spot. Distance migrated by solvent front in TLC= /in paper=
Discussion and Conclusion: What conclusion can you make about the amino acid composition of each Urine samples.