Background and aims
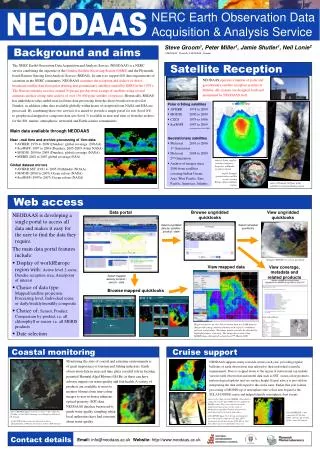
Web access. Data portal. Browse ungridded quicklooks. View ungridded quicklooks. NEODAAS is developing a single portal to access all data and makes it easy for the user to find the data they require. The main data portal features include:

Background and aims
E N D
Presentation Transcript
Web access Data portal Browse ungridded quicklooks View ungridded quicklooks • NEODAAS is developing a single portal to access all data and makes it easy for the user to find the data they require. • The main data portal features include: • Display of world/Europe region with: Active level 2 areas, Dundee reception area, Area/point of interest • Choice of data type: Mapped/satellite projection, Processing level, Individual scene or daily/weekly/monthly composite • Choice of: Sensor, Product, Comparison by product i.e. all chlorophyll or sensor i.e. all MERIS products • Date selection Select ungridded data by satellite / product / date Select individual quicklooks Example MODIS true colour quicklook View mapped data View coverage, metadata and related products Select mapped data by product / sensor / date Browse mapped quicklooks Registered users can view full resolution data in a JAVA browser that provides image analysis features such as pixel coordinates and real world values. The image palette can also be stretched to highlight features of interest. The image above shows 1km MODIS Aqua chlorophyll-a data from 27th March 2006. Contact details Email: info@neodaas.ac.uk Website: http://www.neodaas.ac.uk Steve Groom1, Peter Miller1, Jamie Shutler1, Neil Lonie2 1 NEODAAS - Plymouth, 2 NEODAAS - Dundee. Background and aims Satellite Reception The NERC Earth Observation Data Acquisition and Analysis Service (NEODAAS) is a NERC service combining the expertise of the Dundee Satellite Receiving Station (DSRS) and the Plymouth-based Remote Sensing Data Analysis Service (RSDAS). Its aim is to support EO data requirements of scientists in the NERC community. NEODAAS continues the reception and archive of direct broadcast satellite data from polar orbiting and geostationary satellites started by DSRS in the 1970’s. The Station currently receives around 30 passes per day from a range of satellites using several antennas and has a long-term archive of over 130,000 polar satellite overpasses. Historically, RSDAS has undertaken value-added near-real time data processing from the direct broadcast received at Dundee; in addition other data available globally within hours of reception from NASA and ESA are processed. By combining these two services it is aimed to provide a single portal for raw (level 0/1) to geophysical mapped or composite data sets (level 3) available in near-real time or from the archive, for the EO, marine, atmospheric, terrestrial and Earth science communities. NEODAAS operates a number of polar and geostationary satellite reception systems at Dundee. All systems are designed, built and maintained by NEODAAS staff. Polar orbiting satellites • AVHRR 1978 to 2009 • MODIS 2000 to 2009 • CZCS 1979 to 1986 • SeaWiFS 1997 to 2009 (encrypted since Dec 2004) Geostationary satellites • Meteosat 2001 to 2006 1st Generation • Meteosat 2004 to 2009 2nd Generation • Archive of images since 2006 from satellites covering Indian Ocean, Asia, West Pacific, East Pacific, Americas, Atlantic. Main data available through NEODAAS Near –real time and archive processing of 1km data • AVHRR: 1978 to 2009 (Dundee); global coverage (NOAA) • SeaWiFS: 1997 to 2004 (Dundee); 2005-2009 (4-km NASA) • MODIS: 2000 to 2009 (Dundee); global coverage (NASA) • MERIS 2002 to 2007 global coverage (ESA) Global dataset mirrors • AVHRR SST (1981 to 2005) Pathfinder (NOAA) • MODIS (2000 to 2007) Ocean colour (NASA) • SeaWiFS (1997to 2007) Ocean colour (NASA) (above) Polar satellite coverage and pass frequency at Dundee reception station. (right) Example geostationary satellite scene covering Europe-Africa-Atlantic region. (above) Example full pass polar satellite scene from Dundee station. Coastal monitoring Cruise support Monitoring the state of coastal and estuarine environments is of great importance to tourism and fishing industries. Earth observation data in near real time plays a useful role in locating potential Harmful Algal Blooms (HABs) as these can have adverse impacts on water quality and fish health. A variety of NEODAAS supports many research cruises each year, providing regular bulletins of earth observation data tailored to their individual scientific requirements. Data is cropped down to the region of interest and can include various earth observation and model data such as SST, ocean colour products, meteorological updates and sea-surface height. Expert advice is provided in interpreting the data with regard to the cruise aims. Earlier this year routine processing of MODIS top of atmosphere true-colour data began for the SOLAS DOGEE cruise and helped identify atmospheric dust storms. products are available to users to monitor blooms from true-colour images to new in-house inherent-optical-property (IOP) data. NEODAAS data has been used to guide water quality sampling when local authorities have had concerns about water quality. (above left) 7-day stretched MERIS chlorophyll-a composite for 14th April 2006 used to support the MadEx cruise. The cruise aim was to study biophysical interactions to the south of Madagascar (Agulhas Current System) with particular interest in fronts and eddies. (left) MODIS Aqua level-1b top-of-atmosphere true-colour daily composite (5th Aug 2007) showing potential dust storm off W. Africa. Note Sun-glint regions are highlighted in green. (above) MODIS Aqua level2 true-colour 7-day composite (29 May - 4 Jun 2007) showing coccolithophore bloom of W. Ireland (left) AVHRR SST 3-day composite (22-24 Aug 2007), showing up-welling off the coast of Portugal. (right) IOP product showing absorption due to phytoplankton at 443nm. A bloom is visible off W. Ireland