Download

1 / 22
220 likes | 430 Vues
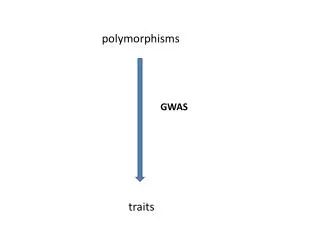
Cataloging polymorphisms in genomes with NGS. Graham Etherington Graham.Etherington@tsl.ac.uk. Outline. Single-nucleotide polymorphisms (SNPs) – what, why and where. Insertions and deletions (Indels) Mapping reads to a genome SNP analysis Indel analysis Filtering – making rules

E N D
Cataloging polymorphisms in genomes with NGS Graham Etherington Graham.Etherington@tsl.ac.uk
Outline • Single-nucleotide polymorphisms (SNPs) – what, why and where. • Insertions and deletions (Indels) • Mapping reads to a genome • SNP analysis • Indel analysis • Filtering – making rules • Tutorial
Why look for SNPs? • SNPs may lead to a change in function or expression of a gene. • premature stop codon • different fold in a protein • higher or lower expression of gene • Genetic markers • SNP may be linked to a gene for a given trait • response to a pathogen (susceptible or resistant)
Types of SNPs • Effect of SNPs vary depending on location. • Intergenic regions • may alter the sequence of regulatory RNAs • Non-coding regions • alteration of promoter and enhancer sequences may change expression of gene • Coding regions • Substitutions • synonymous: no change in the amino acid • non-synonymous: change in amino acid
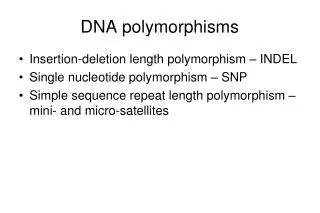
Indels • Insertion/deletion • Differ from SNPs by having at least one nucleotide extra or missing when compared to a reference sequence. • Can cause frame-shifts – codons shift by one creating a different protein sequence after indel. • Indels of a length divisible by 3 cause whole amino acid insertions/deletions, but not frame-shifts.
Indels • Insertions • an ‘extra’ nucleotide appears (inserted) between 2 neighbouring positions • Deletions • a nucleotide is missing (deleted) at a given positions I A F A M A ATCGCGTTTGCCATGGCC ATCGCGTTTCGCCATGGCC I A F R H G Reference Reference ATCGCGTTTGCCATGGCC ATCGCGTTGCCATGGCC I A L P W P • Sometimes a matter of perspective – does the reference have an insertion, or does the query (e.g. a read sequence) have a deletion?
Analysis - the basic steps • Polymorphism analysis in Galaxy involves a number of steps: • Getting data • Quality Control and filtering • Aligning reads to reference • SNP analysis • Indel analysis
Paired-end reads • Sequences can be paired-end • sequences occur as ‘pairs’ with one left-hand (forward) read and one right-hand (reverse) read. • a given distance (insert-size) between the start and end of pairs. Paired -ends Left (forward) read 76 nucleotides Right (reverse) read 76 nucleotides 500 nt DNA fragment ~350 nt gap ~500 nt ‘insert size’
FASTQ Format • Illumina sequences are stored as FASTQ format. FASTA format: >AY0038453 CCTCGGAGTGGAAGGGTGAAGCTAGATTCGTGGACGAATCTATGTTAGTGGGGGAG FASTQ format: @HWI-EAS396_0001:6:1:11659:1311#0/1 CCTCGGAGTGGAAGGGTGAAGCTAGATTCGTGGACGAATCTATGTTAGTGGGGGAG +HWI-EAS396_0001:6:1:11659:1311#0/1 `_Z_`WU\R\ddadafcfafcdWdca[facdW[[^W^ca^W^ac^fcdcfab]_X^
Quality Control • Illumina sequencing • Not perfect, contains errors • wrongly called bases • N’s • reads < or > expected read length • low quality • Quality control reads to select highest quality
Quality Control • Quality scores • look at the per-base quality scores Quality Scores Position
Mapping • Align sequenced reads to a reference genome using a next-generation sequence aligner. • Output of alignment program in Sequence Alignment/Map (SAM) format. • The SAM format describes the alignment of sequenced reads to a reference sequence.
Map analysis - SNPs • SNP finding follows a number of steps: • calculating the individual read bases that cover each base in a reference • counting how many read bases are the same as the reference and how many are different • calculating the depth of coverage and quality of the read bases
Map analysis - SNPs • The mpileup format • A multi-column representation of the one or more alignments with per-line base-by-base information on chromosome, position, reference base, consensus base, coverage, quality, etc. 1 2 3 4 5 6 chr1 412 A 2 ., II chr1 413 G 4 ..t, IIIH chr1 414 C 4 ...a III2 chr1 415 C 4 TTTt III7 First 3 columns are information about the reference sequence: Reference name Position Reference base Then 3 columns per sample: 4. Coverage 5. Read bases at that position 6. Read quality at that position Col 5 CharMeaning . Identical base on the same strand , Identical base on the opposite strand ^ Read starts at this position $ Read ends at this position Uppercase letter Different base on the same strand Lowercase letter Different base on the opposite strand
Identifying SNPs • Use a statistical/heuristic approach to identify homozygosity/heterozygosity in mpileups • VarScan • calls SNPs, indels, and consensus genotypes. • genotypes • homozygous to reference base • homozygous to alternative base • heterozygous (combination of reference and alternative bases)
Variant Calling Format (VCF) ##fileformat=VCFv4.1 ##source=VarScan2 ##INFO=<ID=ADP,Number=1,Type=Integer,Description="Average per-sample depth of bases with Phred score >= 15"> ##INFO=<ID=WT,Number=1,Type=Integer,Description="Number of samples called reference (wild-type)"> ##INFO=<ID=HET,Number=1,Type=Integer,Description="Number of samples called heterozygous-variant"> ##INFO=<ID=HOM,Number=1,Type=Integer,Description="Number of samples called homozygous-variant"> ##INFO=<ID=NC,Number=1,Type=Integer,Description="Number of samples not called"> ##FILTER=<ID=str10,Description="Less than 10% or more than 90% of variant supporting reads on one strand"> ##FILTER=<ID=indelError,Description="Likely artifact due to indel reads at this position"> ##FORMAT=<ID=GT,Number=1,Type=String,Description="Genotype"> ##FORMAT=<ID=GQ,Number=1,Type=Integer,Description="Genotype Quality"> ##FORMAT=<ID=SDP,Number=1,Type=Integer,Description="Raw Read Depth as reported by SAMtools"> ##FORMAT=<ID=DP,Number=1,Type=Integer,Description="Quality Read Depth of bases with Phred score >= 15"> ##FORMAT=<ID=RD,Number=1,Type=Integer,Description="Depth of reference-supporting bases (reads1)"> ##FORMAT=<ID=AD,Number=1,Type=Integer,Description="Depth of variant-supporting bases (reads2)"> ##FORMAT=<ID=FREQ,Number=1,Type=String,Description="Variant allele frequency"> ##FORMAT=<ID=PVAL,Number=1,Type=String,Description="P-value from Fisher's Exact Test"> ##FORMAT=<ID=RBQ,Number=1,Type=Integer,Description="Average quality of reference-supporting bases (qual1)"> ##FORMAT=<ID=ABQ,Number=1,Type=Integer,Description="Average quality of variant-supporting bases (qual2)"> ##FORMAT=<ID=RDF,Number=1,Type=Integer,Description="Depth of reference-supporting bases on forward strand (reads1plus)"> ##FORMAT=<ID=RDR,Number=1,Type=Integer,Description="Depth of reference-supporting bases on reverse strand (reads1minus)"> ##FORMAT=<ID=ADF,Number=1,Type=Integer,Description="Depth of variant-supporting bases on forward strand (reads2plus)"> ##FORMAT=<ID=ADR,Number=1,Type=Integer,Description="Depth of variant-supporting bases on reverse strand (reads2minus)"> #CHROM POS ID REF ALT QUAL FILTER INFO FORMAT Sample1 chr01 37 . A T . PASS ADP=27;WT=0;HET=1;HOM=0;NC=0 GT:GQ:SDP:DP:RD:AD:FREQ:PVAL:RBQ:ABQ:RDF:RDR:ADF:ADR 0/1:3:30:23:14:9:39.13%:7.4174E-4:39:37:14:0:9:0 chr01 55 . A G . PASS ADP=16;WT=0;HET=0;HOM=1;NC=0 GT:GQ:SDP:DP:RD:AD:FREQ:PVAL:RBQ:ABQ:RDF:RDR:ADF:ADR 1/1:4:36:12:0:9:75%:2.0568E-5:0:36:0:0:9:0 chr01 85 . A G . PASS ADP=34;WT=0;HET=1;HOM=0;NC=0 GT:GQ:SDP:DP:RD:AD:FREQ:PVAL:RBQ:ABQ:RDF:RDR:ADF:ADR 0/1:5:37:35:19:16:45.71%:1.637E-6:35:36:19:0:16:0 chr01 88 . A T . PASS ADP=30;WT=0;HET=1;HOM=0;NC=0 GT:GQ:SDP:DP:RD:AD:FREQ:PVAL:RBQ:ABQ:RDF:RDR:ADF:ADR 0/1:2:33:31:23:8:25.81%:2.3332E-3:36:19:23:0:8:0 INFO ADP=27;WT=0;HET=2;HOM=0;NC=0 ADP=16;WT=0;HET=0;HOM=2;NC=0 ADP=34;WT=1;HET=1;HOM=0;NC=0 ADP=30;WT=1;HET=1;HOM=0;NC=0 ADP=61;WT=1;HET=1;HOM=0;NC=0 ADP=80;WT=1;HET=1;HOM=0;NC=0 ADP=88;WT=1;HET=1;HOM=0;NC=0 ADP=101;WT=1;HET=1;HOM=0;NC=0 ##INFO=<ID=ADP,Number=1,Type=Integer,Description="Average per-sample depth of bases with Phred score >= 15"> ##INFO=<ID=WT,Number=1,Type=Integer,Description="Number of samples called reference (wild-type)"> ##INFO=<ID=HET,Number=1,Type=Integer,Description="Number of samples called heterozygous-variant"> ##INFO=<ID=HOM,Number=1,Type=Integer,Description="Number of samples called homozygous-variant"> ##INFO=<ID=NC,Number=1,Type=Integer,Description="Number of samples not called">
Identifying SNPs • Filter snps based on some rules • Coverage: what minimum depth of coverage do you require • Genotype: what genotypes, or combination of genotypes are you looking for • Alternative allele frequency: 0.5? 0.33?
Identifying Indels • SAM file has information about how the reads map to genome – includes insertions and deletions • Indel extraction output in Galaxy allows us to visualise indels • VarScan also has a tool to extract Indels • Like SNP-calling, provide some parameters to filter for most probable indels.
Visualisation • Galaxy Trackster • view read alignments • view SNPs • view Indels
Visualisation A>T SNP
Tutorial • Time to put what I’ve said into practice. • Use Galaxy: galaxy.tsl.ac.uk • Go through the Tutorial. Don’t rush things. Take your time and make sure you understand what each step does and how you are creating a pipeline of analysis.