Doppler Radar
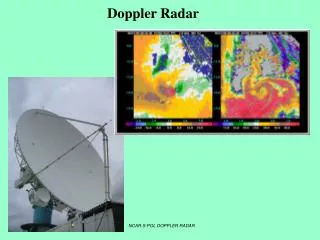
Doppler Radar. From Josh Wurman. NCAR S-POL DOPPLER RADAR. Doppler Shift : A frequency shift that occurs in electromagnetic waves due to the motion of scatterers toward or away from the observer.


Doppler Radar
E N D
Presentation Transcript
Doppler Radar From Josh Wurman NCAR S-POL DOPPLER RADAR
Doppler Shift: A frequency shift that occurs in electromagnetic waves due to the motion of scatterers toward or away from the observer. Analogy: The Doppler shift for sound waves is the frequency shift that occurs as race cars approach and then recede from a stationary observer Doppler radar: A radar that can determine the frequency shift through measurement of the phase change that occurs in electromagnetic waves during a series of pulses.
The electric field of a transmitted wave The returned electric field at some later time back at the radar The time it took to travel Substituting: The received frequency can be determined by taking the time derivative if the quantity in parentheses and dividing by 2p
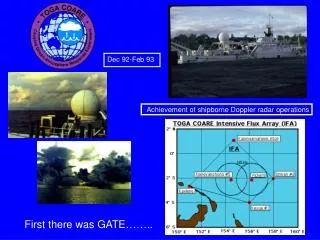
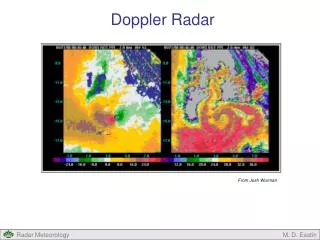
Sign conventions The Doppler frequency is negative (lower frequency, red shift) for objects receding from the radar The Doppler frequency is positive (higher frequency, blue shift) for objects approaching the radar These “color” shift conventions are typically also used on radar displays of Doppler velocity Red: Receding from radar Blue: Toward radar
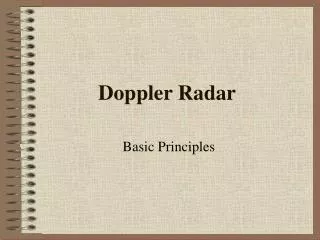
Note that Doppler radars are only sensitive to the radial motion of objects Air motion is a three dimensional vector: A Doppler radar can only measure one of these three components – the motion along the beam toward or away from the radar
Magnitude of the Doppler Shift Transmitted Frequency X band C band S band 9.37 GHz 5.62 GHz 3.0 GHz Radial velocity 62.5 Hz 37.5 Hz 20.0 Hz 625 Hz 375 Hz 200 Hz 3125 Hz 1876 Hz 1000 Hz 1 m/s 10 m/s 50 m/s These frequency shifts are very small: for this reason, Doppler radars must employ very stable transmitters and receivers
RECALL THE BLOCK DIAGRAM OF A DOPPLER RADAR AND THE “PHASE DETECTOR”
Amplitude determination: Phase determination:
Why is emphasis placed on phase determination instead of determination of the Doppler frequency? Typical period of Doppler frequency = 0.3 to 50 milliseconds Typical pulse duration = 1 microsecond Only a very small fraction of a complete Doppler frequency cycle is contained within a pulse Alternate approach: one samples the Doppler-shifted echo with a train of pulses and tries to reconstruct, or estimate, the Doppler frequency from the phase change that occurs between pulses.
We can understand how the phase shift can be related to the radial velocity by considering a single target moving radially. Distance target moves radially in one pulse period Tr The corresponding phase shift of a wave between two Consecutive pulses (twice (out and back) the fraction of a wavelength traversed between two consecutive pulses) (1) Solving for the radial velocity In practice, the pulse volume contains billions of targets moving at different radial speeds and an average phase shift must be determined from a train of pulses
Illustration of the reconstruction of the Doppler frequency from sampled phase values Dots correspond to the measured samples of phase f
PROBLEM More than one Doppler frequency (radial velocity) will always exist that can fit a finite sample of phase values. The radial velocity determined from the sampled phase values is not unique
What is the maximum radial velocity possible before ambiguity in the measurement of velocity occurs? We need at least two measurements per wavelength to determine a frequency The phase change between pulses must therefore be less than half a wavelength From (1) vmax is called the Nyquist velocity and represents the maximum (or minimum) radial velocity a Doppler radar can measure unambiguously – true velocities larger or smaller than this value will be “folded” back into the unambiguous range
EXAMPLE VALUES OF THE MAXIMUM UNAMBIGUOUS DOPPLER VELOCITY Wavelength Radar PRF (s-1) cm 200 500 1000 2000 3 1.5 3.75 7.5 15 5 2.5 6.25 12.5 25 10 5.0 12.5 25.0 50 Table shows that Doppler radars capable of measuring a large range of velocities unambiguously have long wavelength and operate at high PRF
Folded velocities in an RHI Velocities after unfolding http://apollo.lsc.vsc.edu/classes/remote/graphics/airborne_radar_images/newcastle_folded.gif
But recall that for a large unambiguous RANGE Doppler radars must operate at a low PRF THE DOPPLER DILEMA: A GOOD CHOICE OF PRF TO ACHIEVE A LARGE UNAMBIGUOUS RANGE WILL BE A POOR CHOICE TO ACHIEVE A LARGE UNAMBIGUOUS VELOCITY
Ways to circumvent the ambiguity dilema 1. “Bursts” of pulses at alternating low and high pulse repetition frequencies Measure reflectivity Measure velocity Low PRF used to measure to long range, high PRF to measure velocity
2. Use slightly different PRFs in alternating sequence For 1st PRF For 2nd PRF Solve simultaneously Example: l = 5.33 cm, F = 900 s-1, F = 1200 s-1 MEASURE fd = -150 hz, fd = 450 hz Data is folded once
Real characteristics of a returned signal from a distributed target Velocity of individual targets in contributing volume vary due to: 1) Wind shear (particularly in the vertical) 2) Turbulence 3) Differential fall velocity (particularly at high elevation angles) 4) Antenna rotation 5) Variation in refraction of microwave wavefronts
NET RESULT: A series of pulses will measure a spectrum of velocities (Doppler frequencies) Power per unit velocity interval (db)
The moments, or integral properties, of the Doppler Spectrum Average returned power Mean radial velocity Spectral width
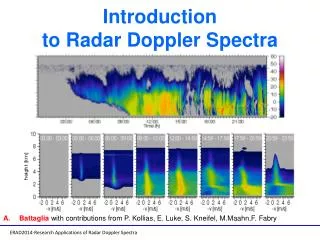
Example of Doppler spectra As a function of altitude measured in a winter snowband. These spectra were measured with a vertically pointing Doppler profiler with a rather wide (9 degree) beamwidth Melting level Note ground clutter
The Doppler spectrum represents the echo from a single contributing region Mean Doppler frequency (or velocity) Related to the reflectivity weighted mean radial motion of the particles Related to the relative particle motions Spectral width RECALL: Fluctuations in mean power from pulse to pulse occur due to interference effects as the returned EM waves superimpose upon one another. Fluctuations are due to the relative motion of the particles between pulses and therefore to the spectral width
Effects of relative particle motion: Consider two particles in a pulse volume Where: Return from 1: Return from 2: With a bit of trigonometry…. Where: Total Echo power proportional to sum of two fields squared Constant term Term which depends on particles relative velocities and wavelength
For a large ensemble of particles To determine the echo power, one must average over a large enough independent samples that the second term averages to zero HOWEVER!! To determine the Doppler frequency (and velocity) from consecutive measurements of echo phase, the samples must be DEPENDENT (more frequent) than those required to obtain the desired resolution in reflectivity
Determining the Doppler Spectrum 1. Doppler spectrum is measured at a particular range gate (e.g. at ) 2. Must process a time series of discrete samples of echo Er(t) at intervals of the pulse period Tr 3. Analyze the sampled signal using (fast) Fourier Transform methods: M = # of samples f0 = frequency resolution 4. Frequency components (radial velocities) occur at discrete intervals, with M intervals separated by intervals of 1/MTr = fD
Discrete Doppler spectra computed for a point target, with M = 8. Dots represent the discrete frequency components of the spectra. Point target, M = 8 fD = 2 f0 If Doppler frequency is not an integral multiple of the frequency resolution (normally not the case), the discrete Fourier transform will “smear” power into all of the frequencies across the spectrum. Point target, M = 8 fD = 2.5 f0 Signal appear in all M lines of the spectrum
With a distributed target, which has a spectrum of Doppler frequencies, the discrete Fourier transform will always produce power in all frequencies. The power will be relatively uniform at frequencies not associated with the true Doppler frequencies, and peak across the range of true Doppler frequencies. Noise Signal Noise
In most applications (such as the operational NEXRADs), the Doppler spectra are not needed. Recording the entire Doppler spectra at each range gate takes an enormous amount of data storage capability, quickly exceeding the capacity of current electronic storage devices. What are needed are the moments of the spectra – the average returned power, the mean Doppler velocity, and the spectral width
How can the moments be obtained from the series of discrete samples? • Record time series at each range gate and Fourier analyze Doppler Spectra. Calculate the moments. Discard Spectral data. (Computationally inefficient, given that these calculations must be done for every range gate on every beam! • or… • 2. Calculate moments as the time series is recorded using the Autocorrelation function (see below), and discard data continuously following the calculation (little data storage required and computationally efficient)
Problems complicating process: 1. Noise Tends to bias Vr to 0 and spectral width to vmax/3 2. Folding 3. Clutter
RECALL THE PHASE DETECTOR IN A DOPPLER RADAR SYSTEM Amplitude determination: Phase determination:
Sample of I/Q channel voltage at time 1: Sample of I/Q channel voltage at time 2: Autocorrelation function:
Representation of I/Q signal on a phase Diagram in complex space wd Amplitude f1
Graphical depiction of how average amplitude (returned power) And phase (radial velocity) are recovered from autocorrelation function f5-f4 f4-f3 f3-f2 f2-f1 The spectral width can also be recovered from autocorrelation function