Download

1 / 22
220 likes | 493 Vues
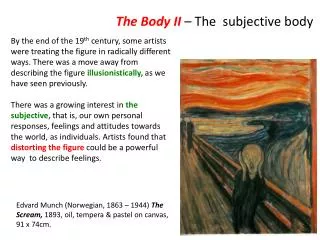
The UCLA Body Matrices II. David Frederick Anne Peplau UCLA Department of Psychology Acknowledgements: Thanks to Jim Compton of SNSL Imagination for assistance creating the UCLA Body Matrices (SNSLimagination@aol.com)

E N D
The UCLA Body Matrices II David Frederick Anne Peplau UCLA Department of Psychology Acknowledgements: Thanks to Jim Compton of SNSL Imagination for assistance creating the UCLA Body Matrices (SNSLimagination@aol.com) Contact: David Frederick at enderflies1@aol.com. Available at the following website: dred.bol.ucla.edu
Problems in Measuring Body Satisfaction • Women’s Bodies • Forms used to assess women’s body types confound body fat and breast size, or only manipulate one of these features. • Men’s Bodies • Similarly, forms for men appear to confound muscularity with body fat, or only manipulate one of these features. • Hand-Drawn Images • All existing forms utilize crude hand-drawn silhouettes of men and women.
The UCLA Body Matrices • We introduce the UCLA Body Matrices as an improvement over existing forms. These new matrices provide more levels of body fat for women and muscularity for men • The UCLA Matrix of Men systematically varies: • 4 levels of body fat, from slender (10)* to heavy (40) • 7 levels of muscularity, from non-muscular (10) to very muscular (70) • The UCLA Matrix of Women systematically varies: • 4 levels of breast size, from small (10) to large (40) • 8 levels of body fat, from slender (10) to heavy (80) *The numbers correspond to equally spaced intervals according to the software used, not objective measurements (e.g., not 10% body fat).
Pick a Number vs. Scaled Versions • Pick A Number Version: • Each one of the images is numbered • Participants are simply asked to indicate which image best represents their current body, the ideal body, the typical body, etc. • The advantage is this version is very simple for participants • Scaled Version • Participants indicate which image best represents their current body, etc., using a latitude-longitude system. • This is more complex for participants but allows them to indicate intermediate values (e.g., they can indicate that their breast size is between levels 30 and 40). • *Matrices can be viewed at: http://dfred.bol.ucla.edu/UCLAbody.html
Present Research • 1. Do rating of one’s current body, ideal body, and the discrepancy between these ratings predict measures of: • Body Mass (BMI)? • Breast Cup Size • Overall body satisfaction (Appearance Evaluation Scale; (Cash, 2000)? • Drive for muscularity (McCreary & Sasse, 2000)? • Breast size satisfaction (Forbes & Frederick, under review) • 2. Do people perceive a difference between their current and their ideal body? • 3. Do people perceive a difference between the typical and most attractive body type of the other sex? • 4. Do the measures show high test-retest reliability?
Study 1: Pick A Number Version • Participants were 102 men and 255 women in a psychology class who participated in exchange for extra credit. • Mean Age = 18.94 • 26% White, 41% Asian, 14% Hispanic, 19% Other.
Validating the UCLA Body Matrices:Association to BMI and Breast Size • Linear Regressions predicting BMI • Men (Muscularity and Body fat to BMI): • Model R = .74 • Women (Breast Size and Body fat to BMI): • Model R = .71 • Linear Regressions predicting cup size • (Breast size and Body Fat self-reported cup size): • Model R = .76
Association of Matrix Choices to Body Image * The discrepancies are absolute values. For example, Fat Discrepancy = [ABS (current – ideal body fat level.)]
Men and Women’s Ratings of Female Body Fat Women’s Ratings of Body Fat: Women perceived that their current body did not differ from the typical body, but they were heavier than their ideal. Men’s Ratings of Body Fat: Men perceived that the most attractive body was thinner than the ideal body.
Men and Women’s Ratings of Female Breast Size Women’s Ratings of Breast Size: Women did not perceive a difference between their current breast size and the ideal breast size, but did desire larger ideal breasts. Men’s Ratings of Breast Size: Men indicated that the typical breast size was smaller than the ideal breast size.
Men and Women’s Ratings of Male Body Fat Men’s Ratings of Body Fat: Men perceived that they were slightly thinner than average, and slightly heavier than their ideal. Women’s Ratings of Body Fat: Women did not perceive a difference between the typical and ideal level of body fat.
Men and Women’s Ratings of Male Muscularity Men’s Ratings of Muscularity: Men perceived that they were slightly more muscular than average, but were much less muscular than their ideal. Women’s Ratings of Muscularity: Women indicated that the most attractive male body was much more muscular than the typical male body.
Study 2: Scaled Version • Participants were 112 men and 122 women at local campus hangouts who participated in exchange for being entered in a lottery. • Mean Age = 22.88 • 40% White, 25% Asian, 12% Hispanic, 23% Other.
Validating the UCLA Body Matrices:Association to BMI and Breast Size • Linear Regressions predicting BMI • Men (Muscularity and Body fat to BMI): • Model R = .73 • Women (Breast Size and Body fat to BMI): • Model R = .67 • Linear Regressions predicting cup size • (Breast size and Body Fat self-reported cup size): • Model R = .76
Association of Matrix Choices to Body Image * The discrepancies are absolute values. For example, Fat Discrepancy = [ABS (current – ideal body fat level.)]
Men and Women’s Ratings of Female Body Fat Women’s Ratings of Body Fat: Women did not perceive a difference between their body and the typical body, but were heavier than their ideal body. Men’s Ratings of Body Fat: Men indicated that the most attractive body was thinner than the typical body.
Men and Women’s Ratings of Female Breast Size Women’s Ratings of Breast Size: Women did not perceive a difference between their current body and the typical body, but desired larger breasts. Men’s Ratings of Breast Size: Men indicated that the most attractive breast size was larger than the typical breast size.
Men and Women’s Ratings of Male Body Fat Men’s Ratings of Body Fat: Men believed they were slightly thinner than average, but slightly heavier than their ideal. Women’s Ratings of Body Fat: Women did not perceive a difference between the typical and most attractive body fat level.
Men and Women’s Ratings of Male Muscularity Men’s Ratings of Muscularity: Men perceived that they were slightly more muscular than average, but much less muscular than their ideal body. Women’s Ratings of Muscularity: Women indicated that the most attractive body was more muscular than the typicial male body.
Summary of Findings • The results suggest that the matrices are useful measures of body image and body type preferences. Responses were: • Strongly related to BMI and self-reported breast cup-size • Associated with global body satisfaction, and breast size/muscularity satisfaction • Congruent with past research on body type preferences
![[MATRICES ]](https://cdn4.slideserve.com/144276/matrices-dt.jpg)