Download
1 / 28
290 likes | 371 Vues
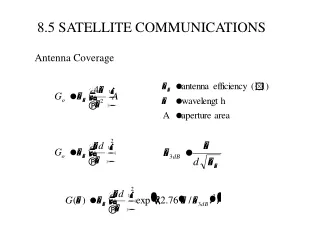
8.5 SATELLITE COMMUNICATIONS. Antenna Coverage. Figure 8-29. (a) Satellite repeater link. (b) Frequency-translation satellite communications relay. (c) Demod/remod satellite communications relay. Figure 8-30 Polar representation of a general antenna gain function. Example 8.4.

E N D
8.5 SATELLITE COMMUNICATIONS Antenna Coverage
Figure 8-29. (a) Satellite repeater link. (b) Frequency-translation satellite communications relay. (c) Demod/remod satellite communications relay.
Figure 8-30 Polar representation of a general antenna gain function.
Earth Station and Transmission Methods Figure 8-31 Satellite ground station receiver/transmitter configuration. The command transmitter and telemetry receivers are not shown.
Figure 8-32 Illustration of multiple-access techniques. (a) FDMA. (b) TDMA. (c) CDMA using frequency-hop modulation (numbers denote hopping sequences for channels 1, 2, and 3.
Figure 8-34 Signal and noise powers in the uplink and downlink portions of a bent-pipe satellite relay system.
Figure 8-35 Transition probability diagram for uplink and downlink errors on a demod/remod satellite relay. Figure 8-35 Transition probability diagram for uplink and downlink errors on a demod/remod satellite relay.
Figure 8-36 Comparison of bent-pipe and OBP relay characteristics.
Figure 8-37 Hexagonal grid system representing cells in a cellular radio system; a reuse pattern of seven is illustrated.
From performance analysis to physical transceiver specs • Link budget analysis connects performance analysis to physical transceiver specs • Transmit power • Antenna directivities at Tx and Rx • Quality of receiver circuitry (how much noise do we incur) • Desired link range
Taking stock of what we know • Given bit rate and signal constellation (including any error correction code that is used), we know the required modulation degrees of freedom per unit time (the symbol rate) • This gives minimum Nyquist bandwidth • Now factor in excess bandwidth • Given the constellation and desired BER, can find Eb/N0 required, and hence the required SNR • SNR=(energy/bit * bits/sec)/(noise PSD*bandwidth) • Given receiver noise figure and bandwidth, can find noise power We can now specify the receiver sensitivity (min required received power): Receiver sensitivity (typically quoted in dBm)
Carrier wavelength Transmit power Receive antenna directivity Transmit antenna directivity Range Friis’ Formula (free space propagation) Antenna directivity (gain with respect to isotropic antenna) is often expressed in dB scale Friis’ Formula in dB scale
Link Budget Equations More generally, the received power is given by for free space propagation Add on a link margin (to compensate for unforseen or unmodeled performance losses) to get the link budget:
Example: link budget for a WLAN WLAN link at 5 GHz 20 MHz bandwidth, QPSK, excess bandwidth 33%, receiver noise figure 6 dB BIT RATE Symbol rate Bit rate REQUIRED SNR 10-6 BER for QPSK requires Eb/N0 of 10.2 dB (use BER formula ) ) In dB,
Receiver sensitivity (transmit power of 100 mW, or 20 dBm, and antenna directivities of 2 dBi at Tx and Rx) Find the max allowable path loss for the desired receiver sensitivity: Max. allowable path loss Invert path loss formula for free space propagation Range is 107 meters Of the order of advertised WiFi ranges Link budget for WLAN (contd.) Noise power Try variants: redo for other constellations; carrier frequency of 60 GHz with antenna directivities of 20 dBi.