Ch.4. Groundwater
130 likes | 267 Vues
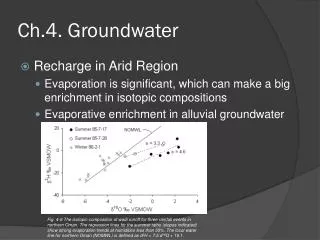
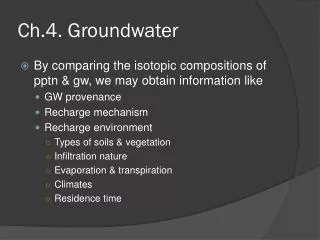
Ch.4. Groundwater. By comparing the isotopic compositions of pptn & gw , we may obtain information like GW provenance Recharge mechanism Recharge environment Types of soils & vegetation Infiltration nature Evaporation & transpiration Climates Residence time.

Ch.4. Groundwater
E N D
Presentation Transcript
Ch.4. Groundwater • By comparing the isotopic compositions of pptn & gw, we may obtain information like • GW provenance • Recharge mechanism • Recharge environment • Types of soils & vegetation • Infiltration nature • Evaporation & transpiration • Climates • Residence time
Recharge in Temperate Climate • Features • < 5-25% of pptn infiltrates • Transportation little affects iso-comp. • Transpiration little affects iso-comp. • Recharge: Highest in spring & Fall? Why? can cause bias in iso-comp
Attenuation of seasonal variation • The various pathways of the unsaturated zone mixes the water and averages out the iso-comp
The critical depth is usually located above water table (if it’s below, iso-comp of gw can have a little fluctuation) • Below critical depth, variation in d is less than 2s. • What if variation in d is bigger than 2s? • GW mixing? • Significantly preferential pathways? • Change in climate?
Comparing shallow GW w/ Pptn • In most cases, d of GW is about close to the weighted average of d of Pptn. • If there is deviation, that’s due to • Recharge biases • Land use practices • Climates
Fig. 4-8 The distribution of d18O values in locally recharged groundwater across Canada, and the weighted mean values for d18O in precipitation at monitoring stations (modified from Fritz et al., 1987a with additional regional groundwater data; Arctic precipitation data from Moorman et al., 1996).
From Fig. 4-5, can you see • Continental effect • Altitude effect • Source effect • Recharge bias • ?
Other processes that can be observed from the regional distribution of 18O in groundwaters across Canada include: • The warm Pacific air masses rise over the western Cordillera where orographic rainout over the Coast Mountains produces a steep d18O gradient (Yonge et al., 1989) and a regional alpine effect. • A southward gradient extends across the northern Yukon from the north coast, indicating vapour originating from the Beaufort Sea during summer. • Low values are found in the vicinity of the high latitude Mackenzie Mountains along the Yukon - Northwest Territories border. • The gradient across eastern maritime Canada indicating vapour arriving from the Atlantic, with the contouring of isopleths around the Appalachian Mountains due to the local alpine effect.
Recharge by snowmelt • Modifying d by • Sublimation and vapor exchange in the snowpack • Exchange between the snow and meltwater