Download
1 / 17
170 likes | 318 Vues
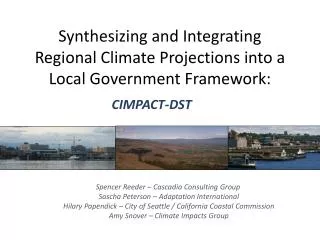
Synthesizing and Integrating Regional Climate Projections into a Local Government Framework :. CIMPACT-DST. Spencer Reeder – Cascadia Consulting Group Sascha Peterson – Adaptation International Hilary Papendick – City of Seattle / California Coastal Commission

E N D
Synthesizing and Integrating Regional Climate Projections into a Local Government Framework: CIMPACT-DST Spencer Reeder – Cascadia Consulting Group Sascha Peterson – Adaptation International Hilary Papendick – City of Seattle / California Coastal Commission Amy Snover – Climate Impacts Group
The Various Roles of Decision Support Tools National Academy of Sciences: America’s Climate Choices: Adapting to the Impacts of Climate Change (2010)
Classification of Decision Support Tools • Guidebooks(CRiSTAL, CIG/ICLEI/King County, StormSmart Coasts) • Climate impact maps & scenario visualization tools (CIG maps, NOAA hazard assessment tool & SLR visualizer, OSU ENVISION, COAST, NatureServe VISTA) • Databases/Clearinghouses (Climate Adaptation Knowledge Exchange, WeAdapt) • Engagement strategies & methodologies (Coast-Smart Communities, Climate Witness, Scenario Planning)
Simplifying the Process CIMPACT-DST
Key Challenge What Most Decision Makers Want: Upper Extreme • Impact A Best Estimate Lower Extreme Year X, Y, Z
What Science Often Produces: Upper Upper Upper • Impact A • Impact A • Impact A Best Best Best Model Analysis 1 Model Analysis 4 Lower Lower Lower Empirical Analysis 7
Projected Increases in Annual Temperature Compared with 1970-1999 average 2080s +5.3ºF (2.8-9.7ºF) 2040s +3.2ºF (1.6-5.2ºF) 2020s +2.0ºF (1.1-3.4ºF) °F °C Project Lifespan Parameter Choice of emissions scenario matters more after 2040s Climate Impacts Group 2009, Ch. 1
Global Emissions & SRES Projections Fast method for updating global fossil fuel carbon dioxide emissions G Myhre, K Alterskjær, and D Lowe Environ. Res. Lett. 4 (2009)
Considering Alternate Approaches: Benefits vs. Limitations of formal Scenario Planning Approach Major Benefits: • Consistent with conventional risk management approaches • Allows for an organization to explicitly “test decisions under a variety of plausible futures.” (D. Weeks et al, Parks Science, Aug. 2011) Major Limitations: • Requires “availability of technical and financial capacity to handle scenario information” (S. Dessaiet al, Global Environmental Change, 2005) • Requires significant investment of time by staff
Integrating Key Factors in the CIMPACT-DST Climate Observations & Projections Best Practices State & Federal Regulations Local Gov’t Policies Spatial Information
Functional Overview Project Factors Climate Factors • Primary Impacts • Temperature • Sea Level Rise • Precipitation • Type • Bridge • Building (new/remodel) • Drainage System • Electricity Distribution • Park/Open Space • Right-of-Way • Secondary Impacts • Thermal Loads/Stress • Erosion/Landslides • Flooding • Etc. …. • Lifespan • Up to 2030 • Up to 2050 • Up to 2090 • Beyond 2090 • Outputs • Overview • Impact Range • Guidance • Hazard Zone • Flood Zone • Landslide • Sea Level Rise CIMPACT-DST
Seattle Project Objectives & Status • Deploying the tool as part of an effort to integrate climate change adaptation into capital project design • Status: • Building internal awareness with City staff • Pilot testing with a variety of projects (e.g., bridge project) • Integrating tool into current City project design process
Last Slide • Next Steps: • Continue to deploy tool with local governments • Examine non-infrastructure focused applications • Acknowledgements: City of Seattle staff, Adaptation International – Sascha Peterson, Cascadia Staff - Shannon Donegan, Christy Shelton, Andrea Martin, Sidney Brown. Contact info: spencer@cascadiaconsulting.com