Image processing
Image processing. Simple transformations: translation, scaling rotation. Reading in images Logical arrays, masking Thresholding and bwlabel Immunoflourescence Application: Msh5 imaging during meiosis Applying some transformations to imaging data. Transformations.

Image processing
E N D
Presentation Transcript
Image processing • Simple transformations: translation, scaling rotation. • Reading in images • Logical arrays, masking • Thresholding and bwlabel • Immunoflourescence • Application: Msh5 imaging during meiosis • Applying some transformations to imaging data
Transformations 1. Translation: involves simply shifting points in the plane. We can achieve this by creating a matrix Tv which we use as an "translation operator". We start by defining a matrix, If the points we want to transform are in the following (matrix) form:
Scaling • Other linear transformations use the same concept of using a matrix as an operator. • For scaling (i.e. enlarging or shrinking) we define a different matrix operator,
Rotation • Again the only thing that changes here is the matrix operator. • For a rotation about the origin of θ radians, we use the following matrix:
Exercises Download the file “shapeCoords.m”. This is a function which returns a set of (x,y) points. 1. Write a function for scaling the shape by a scalar factor (i.e., vx=vy). Scale the shape by ½, then plot the new figure in green (using “hold on”). 2. Similarly, write a function for rotation. Rotate the figure by 90o and plot in blue.
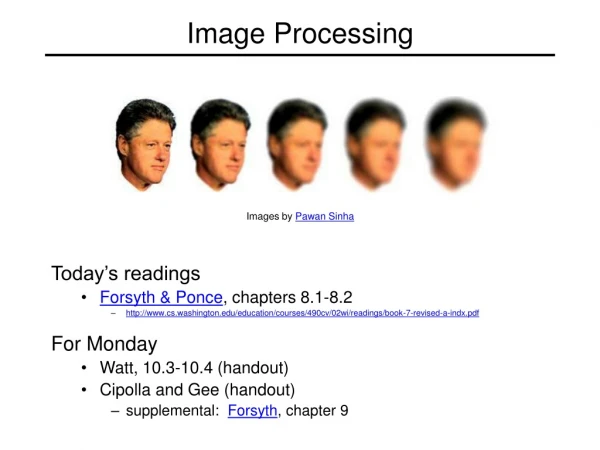
Reading in images • Images are read into Matlab as matrices. • You can use the imread function (part of the Image octave package and Matlab Imaging toolkit) to read images directly into a matlab variable. • We will be working with two cell microscopy images as well as a mask which tells us where a particular cell boundary is.
Reading images • Download the file small.jpg into your home directory. • Read the image using the imread function which reads the image into a red/green/blue matrix. r = imread(‘~/small.jpg'); • What are the dimensions of the image? • You can display each image using the image or imshow functions, e.g. imshow(r) image(r) • Each entry in the matrix is an integer in the range [0,255] indicating intensity.
Logical arrays • Consider the following statements a = [1 2 3; 5 6 7; 7 8 9]; b = a>5; whos • You will see that while a is of type “double”, b is of type “logical” • To convert a double array into logical: c = logical(a) • Any arithmetic operation will convert a logical back into a double, e.g. c = c+0
Mask operations • It is possible to use logical arrays as a mask for arithmetic operations: a(b) = sqrt(a(b)) • Alternatively, a(a>5) = sqrt(a(a>5)) • Here, we are using b much like subarray indexing, only here b is a logical array with the same dimensions as a.
Thresholding and counting • Each (monochrome) pixel has a value [0,255] • For simple object detection: • Create a logical matrix using a threshold value • Use the bwlabel() function to attach numeric identifiers (1..n) to the n objects in the image. For example: x = eye(8); x = ~( x|fliplr(x) ); y = bwlabel(x,4) 3. Individual objects can then be selected: y==2
Exercises • For the small image, remove the green and blue channels and redisplay the image in red. • Apply a threshold >=30 to the red channel and count the objects. Hint: bwlabel & max. • Assign different grayscale values (0→60) to the objects in the image and display using image(). Save the results as a PDF file.