MPC-EX hardware design and capability
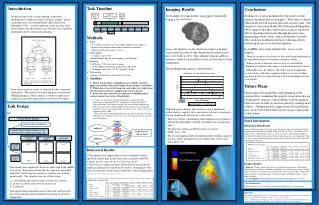
MPC-EX Upgrade at PHENIX Joshua Perry Department of Physics and Astronomy Iowa State University. Left. Left. Right. Right. MPC-EX hardware design and capability

MPC-EX hardware design and capability
E N D
Presentation Transcript
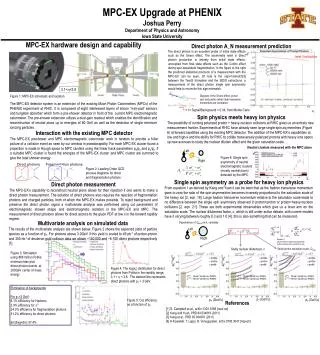
MPC-EX Upgrade at PHENIX Joshua PerryDepartment of Physics and Astronomy Iowa State University Left Left Right Right MPC-EX hardware design and capability The MPC-EX detector system is an extension of the existing Muon Piston Calorimeters (MPCs) of the PHENIX experiment at RHIC. It is composed of eight interleaved layers of silicon “mini-pad” sensors and tungsten absorber which form a pre-shower detector in front of the current MPC electromagnetic calorimeter. The pre-shower extension utilizes a dual-gain readout which enables the identification and reconstruction of neutral pions up to energies of 80 GeV as well as the detection of single minimum ionizing particles. Direct photon A_N measurement prediction The direct photon is an excellent probe of initial state effects such as the Sivers effect. The asymmetry seen in direct photon production is entirely from initial state effects, uncoupled from final state effects such as the Collins effect during spin-dependent fragmentation. In the figure to the right the predicted statistical precision of a measurement with the MPC-EX can be seen. Of note is the sign-mismatch[3] between the Twist3 formalism and the SIDIS extractions, a measurement of the direct photon single spin asymmetry would help to reconcile this sign mismatch. twist-3 extraction Figure 1: MPC-EX schematic and location Diagram of the Sivers effect, proton spin and parton initial state transverse momentum are correlated 3.1<h<3.8 r= Signal/Background = 0.34, from Monte Carlo Spin physics meets heavy ion physics The possibility of running polarized proton + heavy-nucleon collisions at RHIC gives us an entirely new measurement frontier. Experiments at RHIC have already seen large single-spin asymmetries (Figure 6) at forward rapidities using the existing MPC detector. The addition of the MPC-EX’s capabilities at low and high-x and the ability for RHIC to collide transversely polarized protons with heavy ions opens up new avenues to study the nuclear dilution effect and the gluon saturation scale. Interaction with the existing MPC detector The MPC-EX preshower and MPC electromagnetic calorimeter work in tandem to provide a fuller picture of a collision event as seen by our window in pseodorapidity. For each MPC-EX cluster found a projection is made in Hough space to MPC clusters using the linear track parameters px/pz and py/pz. If a suitable MPC cluster is found the energies of the MPC-EX cluster and MPC cluster are summed to give the total shower energy. Neutral clusters measured with the MPC alone Figure 6: Single spin asymmetry of neutral electromagnetic clusters (mostly neutral pions) detected by the MPC. Figure 2: Leading Order QCD process diagrams for direct and fragmentation photons Direct photons Fragmentation photons Single spin asymmetry as a probe for heavy ion physics From equation 1 as derived by Kang and Yuan it can be seen that as the hadron transverse momentum goes to zero the ratio of the spin asymmetries becomes inversely proportional to the saturation scale of the heavy ion [2, eqn. 18]. Large hadron transverse momentum relative to the saturation scale leads to no difference between the single spin asymmetry observed in proton+proton or proton+heavy-nucleon collisions [2, eqn. 21]. These are both experimental observables which give us a lever arm on the saturation scale. The nuclear diluteness factor, c, which is still under active debate, with current models have it varying between roughly 0.3 and 1.0 [4], this is also something that can be measured. Direct photon measurement The MPC-EX’s capability to reconstruct neutral pions allows for their rejection if one wants to make a direct photon measurement. The isolation of direct photons also requires the rejection of fragmentation photons and charged particles, both of which the MPC-EX makes possible. To reject background and preserve the direct photon signal a multivariate analysis was performed using cut parameters of electromagnetic shower shape and electromagnetic isolation in the MPC-EX and MPC. The measurement of direct photons allows for direct access to the gluon PDF at low x in the forward rapidity regime. Study nuclear diluteness, c Study proton saturation scale, Qsat,p Multivariate analysis on simulated data The results of the multivariate analysis are shown below. Figure 2 shows the expected yield of particle species as a function of pT. For photons above 3.0GeV if this yield is scaled to 49 pb-1 of proton-proton and 350 nb-1 of deuteron-gold collision data we obtain ~140,000 and ~8,100 direct photons respectively [1]. Dependence of Qsat,Aon A, centrality Equation 1. (asymmetries modeled using gaussian Collins function at the positivity bound) Figure 3: Simulation using 868 million Pythia minimum bias plus direct photon events at 200GeVcenter of mass energy Figure 4: The log(x2) distribution for direct photons from Pythia in the rapidity range, 3.1 < η< 3.8. The dashed line represents direct photons with pT > 3 GeV. Elimination of backgrounds For pT>3 GeV: 6.1% efficiency for Hadrons 2.9% efficiency for p0 24.3% efficiency for fragmentation photons 31.2% efficiency for direct photons dir/(frag+dir): 57.4% pT (GeV/c) pT (GeV/c) pT (GeV/c) Figure 5: Cut efficiency as a function of pT. References [1] S. Campbell et al., arXiv:1301.1096 [nucl-ex] [2] Kang and Yuan, PRD 84 034019 (2011) [3] Kang et al., PRD 83 094001 (2011) [4] H Kowalski, T. Lappi, R. Venugopalan, arXiv:0705.3047 [hep-ph]